PROTECTED SOURCE SCRIPT
[Vold] Trading Strategy
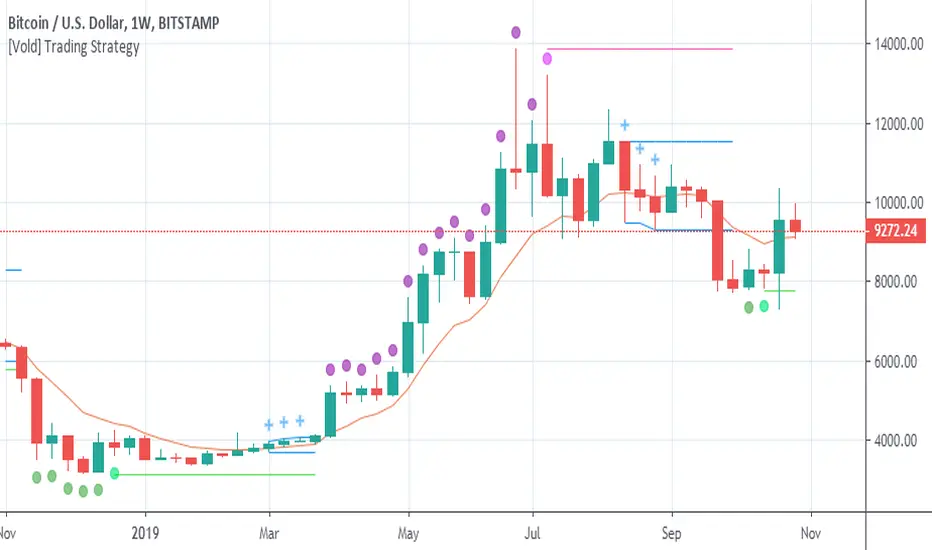
Green dot = Trending down.
Purple dot = Trending up.
Fuchsia dot = Uptrend ended.
Lime dot = Downtrend ended.
Fuchsia line = The highest value of the last trend (breaking it up means continuation.
Lime line = Idem fuchsia line but to the downside.
Blue crosses = Could be different things: 1. A dip to buy, 2. A rally to sell, 3. Building a range ...
Blue range = Depending on the direction it breaks, is the next direction.
Golden line = Candles above favour uptrends, Candles below favour downtrends, also works as support and resistance .
This trading strategy can be traded very mechanically (see this experiment here: tradingview.com/chart/BTCUSD...)
But I don't advice to do that, use it along with other indicators to make better decisions ( RSI for example) or volume of the trends and the end of them. Also, you can use higher timeframes to understand better the context.
보호된 스크립트입니다
이 스크립트는 비공개 소스로 게시됩니다. 하지만 이를 자유롭게 제한 없이 사용할 수 있습니다 – 자세한 내용은 여기에서 확인하세요.
면책사항
해당 정보와 게시물은 금융, 투자, 트레이딩 또는 기타 유형의 조언이나 권장 사항으로 간주되지 않으며, 트레이딩뷰에서 제공하거나 보증하는 것이 아닙니다. 자세한 내용은 이용 약관을 참조하세요.
면책사항
해당 정보와 게시물은 금융, 투자, 트레이딩 또는 기타 유형의 조언이나 권장 사항으로 간주되지 않으며, 트레이딩뷰에서 제공하거나 보증하는 것이 아닙니다. 자세한 내용은 이용 약관을 참조하세요.