PROTECTED SOURCE SCRIPT
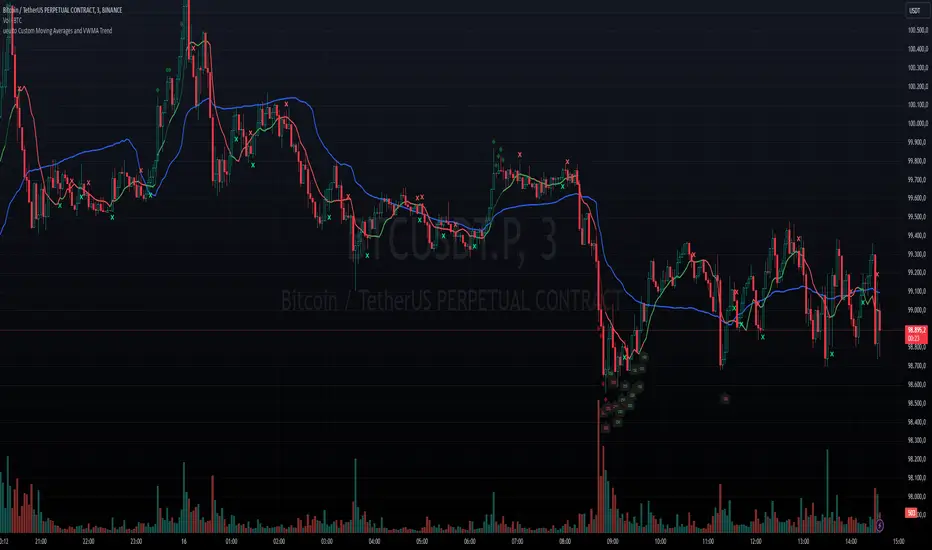
ueuito Custom Moving Averages and VWMA Trend
Description in English:
is a customizable indicator that combines multiple technical analysis tools to identify market trends and buy/sell signals. It integrates moving averages (including VWMA), RSI, MACD, and various configurable levels, providing detailed visual analysis on the chart.
Key Features:
Customizable Moving Averages:
Supports SMA, EMA, WMA, VWMA, and RMA.
Allows for customizing the period and displaying up to two moving averages simultaneously.
VWMA with RSI Indication:
VWMA changes color based on RSI conditions:
Overbought color when RSI exceeds a configurable level.
Oversold color when RSI drops below a configurable level.
MACD and Crossovers:
Detects MACD crossovers with the signal line and highlights them on the chart.
Includes visual indicators to mark key moments of MACD rising or falling.
Overbought/Oversold Signals:
Adds visual markers when RSI exceeds user-defined levels (overbought or oversold).
MACD Level Indicators:
Displays specific values on the chart when MACD reaches predefined levels, with color adjustments based on trend direction.
Advanced Configurations:
Configurable parameters for vertical offset, label colors, and alert levels.
Provides flexibility to tailor the indicator’s appearance and behavior.
Still improving...
보호된 스크립트입니다
이 스크립트는 비공개 소스로 게시됩니다. 하지만 이를 자유롭게 제한 없이 사용할 수 있습니다 – 자세한 내용은 여기에서 확인하세요.
면책사항
해당 정보와 게시물은 금융, 투자, 트레이딩 또는 기타 유형의 조언이나 권장 사항으로 간주되지 않으며, 트레이딩뷰에서 제공하거나 보증하는 것이 아닙니다. 자세한 내용은 이용 약관을 참조하세요.
면책사항
해당 정보와 게시물은 금융, 투자, 트레이딩 또는 기타 유형의 조언이나 권장 사항으로 간주되지 않으며, 트레이딩뷰에서 제공하거나 보증하는 것이 아닙니다. 자세한 내용은 이용 약관을 참조하세요.