PROTECTED SOURCE SCRIPT
Bitcoin: The Puell Multiple
Bitcoin: The Puell Multiple Indicator Overview
The Puell Multiple is an indicator originally used to analyze Bitcoin's valuation based on mining revenue. However, this approximate version uses Bitcoin's current price to give us a similar perspective. It’s helpful for understanding whether Bitcoin’s price is currently high or low compared to its historical trend.
Recommended Timeframe:
For optimal insights, it’s recommended to use this indicator on the weekly timeframe. This timeframe smooths out daily fluctuations, making it easier to capture long-term valuation trends and better understand market cycles.
What Does the Indicator Show?
This indicator compares the current price of Bitcoin to its average price over the past 365 days. Here’s what it helps you see:
When Bitcoin Might Be Undervalued:
If the indicator value is below a certain low threshold (e.g., 0.51 by default), it suggests that Bitcoin might be undervalued compared to its long-term trend. Historically, periods where the indicator is low have sometimes coincided with good buying opportunities, as Bitcoin is seen as “cheap” in relation to its recent average.
When Bitcoin Might Be Overvalued:
If the indicator value is above a certain high threshold (e.g., 3.4 by default), it suggests that Bitcoin might be overvalued. In the past, these high points have sometimes signaled times to consider selling, as Bitcoin is viewed as “expensive” relative to its recent trend.
How to Read the Indicator
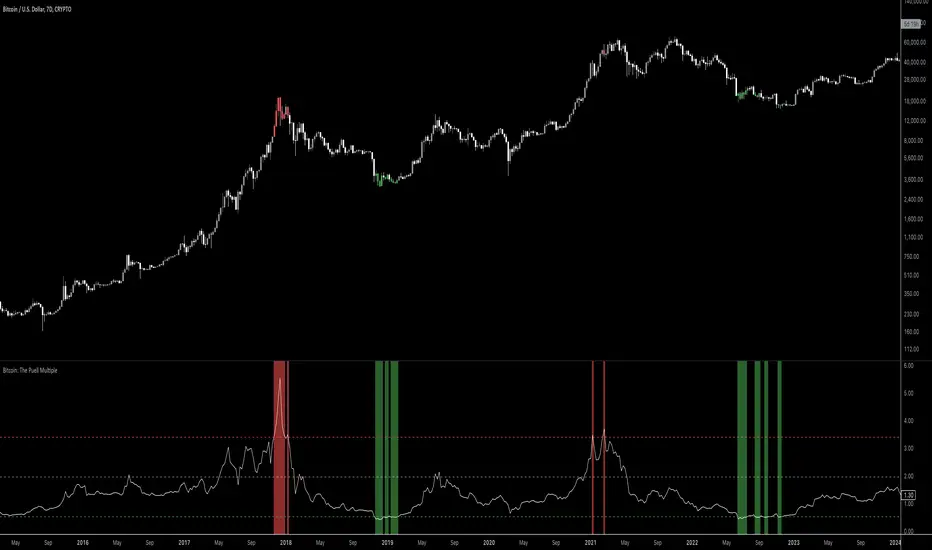
Indicator Line: The main line in the indicator panel shows the value of the Puell Multiple over time, fluctuating based on the comparison between current and past prices.
Threshold Lines: Two horizontal lines represent the high and low thresholds:
Bottom Threshold (Red Line): Indicates a high value, suggesting that Bitcoin might be overvalued.
Top Threshold (Green Line): Indicates a low value, suggesting that Bitcoin might be undervalued.
Color Coding:
The background may appear green when the indicator is below the low threshold (suggesting undervaluation) or red when it’s above the high threshold (suggesting overvaluation).
How You Can Use This Indicator
Long-Term Investment Insights: This indicator can help you identify favorable buying or selling conditions based on historical price trends. When the value is low, Bitcoin might be in a more attractive price range; when it’s high, the price might be inflated compared to its yearly trend.
Market Timing: This tool is best used alongside other indicators, as it’s primarily helpful for understanding broader trends rather than predicting short-term movements.
The Puell Multiple (Approximate) indicator thus offers a historical lens on Bitcoin’s valuation, helping you make decisions informed by past price trends. For best results, keep in mind the weekly timeframe recommendation to capture meaningful market cycles.
The Puell Multiple is an indicator originally used to analyze Bitcoin's valuation based on mining revenue. However, this approximate version uses Bitcoin's current price to give us a similar perspective. It’s helpful for understanding whether Bitcoin’s price is currently high or low compared to its historical trend.
Recommended Timeframe:
For optimal insights, it’s recommended to use this indicator on the weekly timeframe. This timeframe smooths out daily fluctuations, making it easier to capture long-term valuation trends and better understand market cycles.
What Does the Indicator Show?
This indicator compares the current price of Bitcoin to its average price over the past 365 days. Here’s what it helps you see:
When Bitcoin Might Be Undervalued:
If the indicator value is below a certain low threshold (e.g., 0.51 by default), it suggests that Bitcoin might be undervalued compared to its long-term trend. Historically, periods where the indicator is low have sometimes coincided with good buying opportunities, as Bitcoin is seen as “cheap” in relation to its recent average.
When Bitcoin Might Be Overvalued:
If the indicator value is above a certain high threshold (e.g., 3.4 by default), it suggests that Bitcoin might be overvalued. In the past, these high points have sometimes signaled times to consider selling, as Bitcoin is viewed as “expensive” relative to its recent trend.
How to Read the Indicator
Indicator Line: The main line in the indicator panel shows the value of the Puell Multiple over time, fluctuating based on the comparison between current and past prices.
Threshold Lines: Two horizontal lines represent the high and low thresholds:
Bottom Threshold (Red Line): Indicates a high value, suggesting that Bitcoin might be overvalued.
Top Threshold (Green Line): Indicates a low value, suggesting that Bitcoin might be undervalued.
Color Coding:
The background may appear green when the indicator is below the low threshold (suggesting undervaluation) or red when it’s above the high threshold (suggesting overvaluation).
How You Can Use This Indicator
Long-Term Investment Insights: This indicator can help you identify favorable buying or selling conditions based on historical price trends. When the value is low, Bitcoin might be in a more attractive price range; when it’s high, the price might be inflated compared to its yearly trend.
Market Timing: This tool is best used alongside other indicators, as it’s primarily helpful for understanding broader trends rather than predicting short-term movements.
The Puell Multiple (Approximate) indicator thus offers a historical lens on Bitcoin’s valuation, helping you make decisions informed by past price trends. For best results, keep in mind the weekly timeframe recommendation to capture meaningful market cycles.
보호된 스크립트입니다
이 스크립트는 비공개 소스로 게시됩니다. 하지만 이를 자유롭게 제한 없이 사용할 수 있습니다 – 자세한 내용은 여기에서 확인하세요.
면책사항
해당 정보와 게시물은 금융, 투자, 트레이딩 또는 기타 유형의 조언이나 권장 사항으로 간주되지 않으며, 트레이딩뷰에서 제공하거나 보증하는 것이 아닙니다. 자세한 내용은 이용 약관을 참조하세요.
면책사항
해당 정보와 게시물은 금융, 투자, 트레이딩 또는 기타 유형의 조언이나 권장 사항으로 간주되지 않으며, 트레이딩뷰에서 제공하거나 보증하는 것이 아닙니다. 자세한 내용은 이용 약관을 참조하세요.