OPEN-SOURCE SCRIPT
Relative Strength Heat [InvestorUnknown]
The Relative Strength Heat (RSH) indicator is a relative strength of an asset across multiple RSI periods through a dynamic heatmap and provides smoothed signals for overbought and oversold conditions. The indicator is highly customizable, allowing traders to adjust RSI periods, smoothing methods, and visual settings to suit their trading strategies.
The RSH indicator is particularly useful for identifying momentum shifts and potential reversal points by aggregating RSI data across a range of periods. It presents this data in a visually intuitive heatmap, with color-coded bands indicating overbought (red), oversold (green), or neutral (gray) conditions. Additionally, it includes signal lines for overbought and oversold indices, which can be smoothed using RAW, SMA, or EMA methods, and a table displaying the current index values.

Features
How It Works
The RSH indicator aggregates RSI calculations across 31 periods, starting from the user-defined Starting Period and incrementing by the Period Increment. For each period, it computes the RSI and determines whether the asset is overbought (RSI > threshold_ob) or oversold (RSI < threshold_os). These states are stored in arrays (ob_array for overbought, os_array for oversold) and used to generate the following outputs:
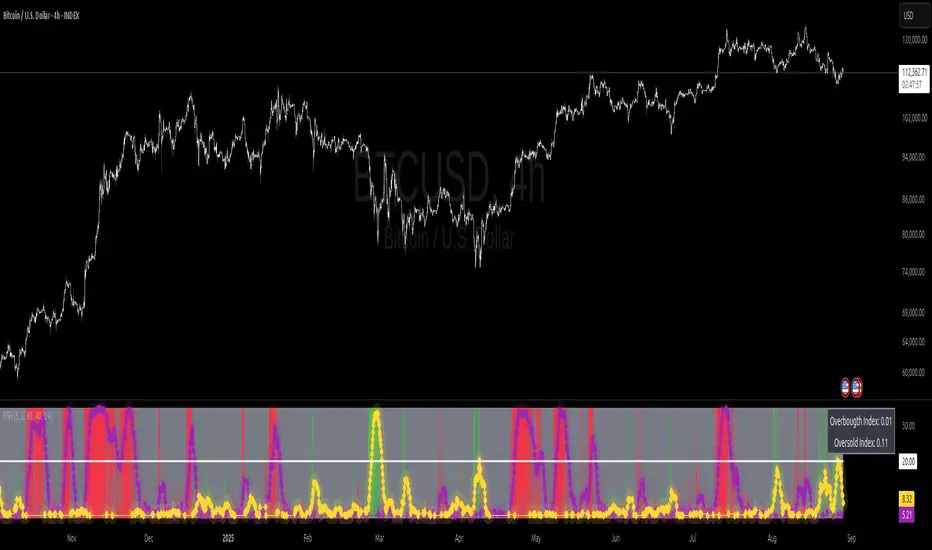
Heatmap: The indicator plots 31 horizontal bands, each representing an RSI period. The color of each band is determined by the f_col function:
Red if the RSI for that period is overbought (>threshold_ob).
Green if the RSI is oversold (<threshold_os).
Gray if neither condition is met. The bands are created using plot and fill functions to form a stacked heatmap.
Signal Indices:
The average of the overbought (avg_ob) and oversold (avg_os) arrays is calculated.
These averages are optionally smoothed using the user-selected method (RAW, SMA, or EMA).
The smoothed indices are scaled to match the RSI period range for plotting as signal lines (scaled_ob_index and scaled_os_index).
Plots:
Overbought Signal Line: Plotted in purple with a stepline-diamond style.
Oversold Signal Line: Plotted in yellow with a stepline-diamond style.
Midline: A white line at the midpoint of the RSI period range for reference.
Table: Displays the current overbought and oversold index values (rounded to two decimal places) in a table at the top-right of the chart.
Disclaimer
This indicator is intended for informational and educational purposes only. It does not constitute investment advice. Historical performance does not guarantee future results. Always backtest and use in simulation before live trading.
The RSH indicator is particularly useful for identifying momentum shifts and potential reversal points by aggregating RSI data across a range of periods. It presents this data in a visually intuitive heatmap, with color-coded bands indicating overbought (red), oversold (green), or neutral (gray) conditions. Additionally, it includes signal lines for overbought and oversold indices, which can be smoothed using RAW, SMA, or EMA methods, and a table displaying the current index values.
Features
- Dynamic RSI Periods: Calculates RSI across 31 periods, starting from a user-defined base period and incrementing by a specified step.
- Heatmap Visualization: Displays RSI strength as a color-coded heatmap, with red for overbought, green for oversold, and gray for neutral zones.
- Customizable Smoothing: Offers RAW, SMA, or EMA smoothing for overbought and oversold signals.
- Signal Lines: Plots scaled overbought (purple) and oversold (yellow) signal lines with a midline for reference.
- Information Table: Displays real-time overbought and oversold index values in a table at the top-right of the chart.
- User-Friendly Inputs: Allows customization of RSI source, period ranges, smoothing length, and colors.
How It Works
The RSH indicator aggregates RSI calculations across 31 periods, starting from the user-defined Starting Period and incrementing by the Period Increment. For each period, it computes the RSI and determines whether the asset is overbought (RSI > threshold_ob) or oversold (RSI < threshold_os). These states are stored in arrays (ob_array for overbought, os_array for oversold) and used to generate the following outputs:
Heatmap: The indicator plots 31 horizontal bands, each representing an RSI period. The color of each band is determined by the f_col function:
Red if the RSI for that period is overbought (>threshold_ob).
Green if the RSI is oversold (<threshold_os).
Gray if neither condition is met. The bands are created using plot and fill functions to form a stacked heatmap.
Signal Indices:
The average of the overbought (avg_ob) and oversold (avg_os) arrays is calculated.
These averages are optionally smoothed using the user-selected method (RAW, SMA, or EMA).
The smoothed indices are scaled to match the RSI period range for plotting as signal lines (scaled_ob_index and scaled_os_index).
Plots:
Overbought Signal Line: Plotted in purple with a stepline-diamond style.
Oversold Signal Line: Plotted in yellow with a stepline-diamond style.
Midline: A white line at the midpoint of the RSI period range for reference.
Table: Displays the current overbought and oversold index values (rounded to two decimal places) in a table at the top-right of the chart.
Disclaimer
This indicator is intended for informational and educational purposes only. It does not constitute investment advice. Historical performance does not guarantee future results. Always backtest and use in simulation before live trading.
오픈 소스 스크립트
트레이딩뷰의 진정한 정신에 따라, 이 스크립트의 작성자는 이를 오픈소스로 공개하여 트레이더들이 기능을 검토하고 검증할 수 있도록 했습니다. 작성자에게 찬사를 보냅니다! 이 코드는 무료로 사용할 수 있지만, 코드를 재게시하는 경우 하우스 룰이 적용된다는 점을 기억하세요.
면책사항
해당 정보와 게시물은 금융, 투자, 트레이딩 또는 기타 유형의 조언이나 권장 사항으로 간주되지 않으며, 트레이딩뷰에서 제공하거나 보증하는 것이 아닙니다. 자세한 내용은 이용 약관을 참조하세요.
오픈 소스 스크립트
트레이딩뷰의 진정한 정신에 따라, 이 스크립트의 작성자는 이를 오픈소스로 공개하여 트레이더들이 기능을 검토하고 검증할 수 있도록 했습니다. 작성자에게 찬사를 보냅니다! 이 코드는 무료로 사용할 수 있지만, 코드를 재게시하는 경우 하우스 룰이 적용된다는 점을 기억하세요.
면책사항
해당 정보와 게시물은 금융, 투자, 트레이딩 또는 기타 유형의 조언이나 권장 사항으로 간주되지 않으며, 트레이딩뷰에서 제공하거나 보증하는 것이 아닙니다. 자세한 내용은 이용 약관을 참조하세요.