OPEN-SOURCE SCRIPT
업데이트됨 Percent of U.S. Stocks Above VWAP
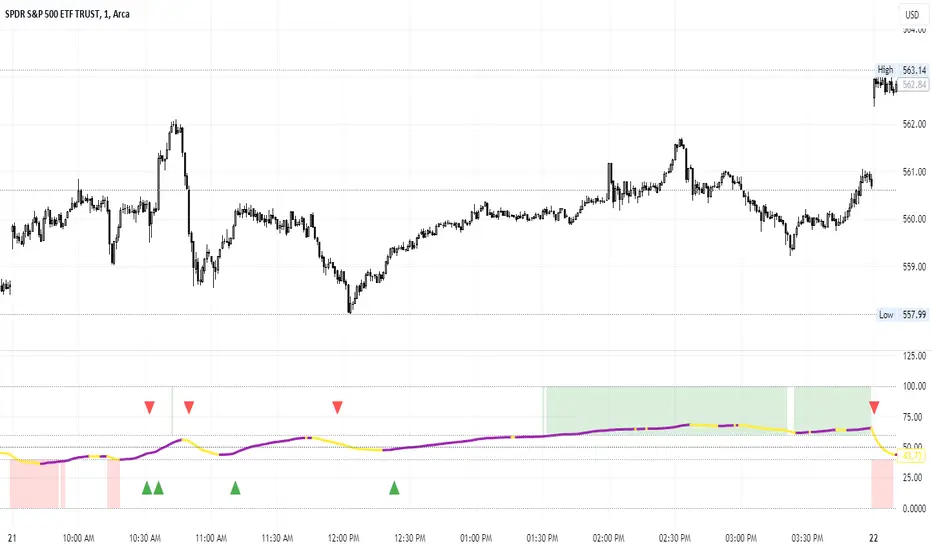
This indicator plots a line reflecting the percentage of all U.S. stocks above or below their VWAP for the given candle. Horizontal lines have been placed at 40% (oversold), 50% (mid-line), and 60% (overbought). I recommend using this indicator as a market breadth indicator when trading individual stocks. In my experience, this indicator is best utilized while trading the major indices (SPX, SPY, QQQ, IWM) or their futures (ES, NQ, RTY) in the following manner:
- When the line crosses 50%, a green or red triangle is plotted indicating the majority of market momentum has turned bullish or bearish based on price positioning vs. VWAP. Look for longs when the line is rising (green) or above 50%, or shorts when the line is falling (red) or below 50%.
- When the line is below 40%, indicator shows red shading; I would not be long anything during this period. When the line exits this level, I begin looking for long entries. This line is adjustable in the indicator settings if you prefer to use a tighter or looser oversold level.
- When the line is above 60%, indicator shows green shading; I would not be short anything during this period. When the line exits this level, I begin looking for short entries. This line is adjustable in the indicator settings if you prefer to use a tighter or looser overbought level.
This indicator uses the TradingView ticker “PCTABOVEVWAP.US”, thus it only updates during NY market hours. If trading futures, I recommend applying VWAP to your chart and using that as the level to trade against in a similar manner, along with your personal price action analysis and other indicators you find useful.
릴리즈 노트
Added EMA line set to 5 (you can adjust) for smoothing purposes. Also modified the middle fill criteria from "white" to "na" for those on "dark mode".릴리즈 노트
Slight modification on forced code change to get the script working again. Remove the script and re-add it for it to start operating properly.릴리즈 노트
Picture update. FYI, I personally use this with only the EMA on looking for longs when rising and shorts when falling.릴리즈 노트
Didn't realize the image needed updating, so here's a more recent price example.Reminder I'm using the EMA of Line setting only since this moves so tight. I've also started setting mine to 15 lookback and use this best on a low time frame chart (1-5 min, though preferably 1 and 2 min).
릴리즈 노트
Fixed EMA to reset at 50% at end of day to shorten EMA catch-up at open. Also changed EMA default to 15 as better indicator of trend on low time frames. Shorten this if using on higher timeframes.오픈 소스 스크립트
트레이딩뷰의 진정한 정신에 따라, 이 스크립트의 작성자는 이를 오픈소스로 공개하여 트레이더들이 기능을 검토하고 검증할 수 있도록 했습니다. 작성자에게 찬사를 보냅니다! 이 코드는 무료로 사용할 수 있지만, 코드를 재게시하는 경우 하우스 룰이 적용된다는 점을 기억하세요.
면책사항
해당 정보와 게시물은 금융, 투자, 트레이딩 또는 기타 유형의 조언이나 권장 사항으로 간주되지 않으며, 트레이딩뷰에서 제공하거나 보증하는 것이 아닙니다. 자세한 내용은 이용 약관을 참조하세요.
오픈 소스 스크립트
트레이딩뷰의 진정한 정신에 따라, 이 스크립트의 작성자는 이를 오픈소스로 공개하여 트레이더들이 기능을 검토하고 검증할 수 있도록 했습니다. 작성자에게 찬사를 보냅니다! 이 코드는 무료로 사용할 수 있지만, 코드를 재게시하는 경우 하우스 룰이 적용된다는 점을 기억하세요.
면책사항
해당 정보와 게시물은 금융, 투자, 트레이딩 또는 기타 유형의 조언이나 권장 사항으로 간주되지 않으며, 트레이딩뷰에서 제공하거나 보증하는 것이 아닙니다. 자세한 내용은 이용 약관을 참조하세요.