OPEN-SOURCE SCRIPT
업데이트됨 Crypto Candle Low Leverage Tracker
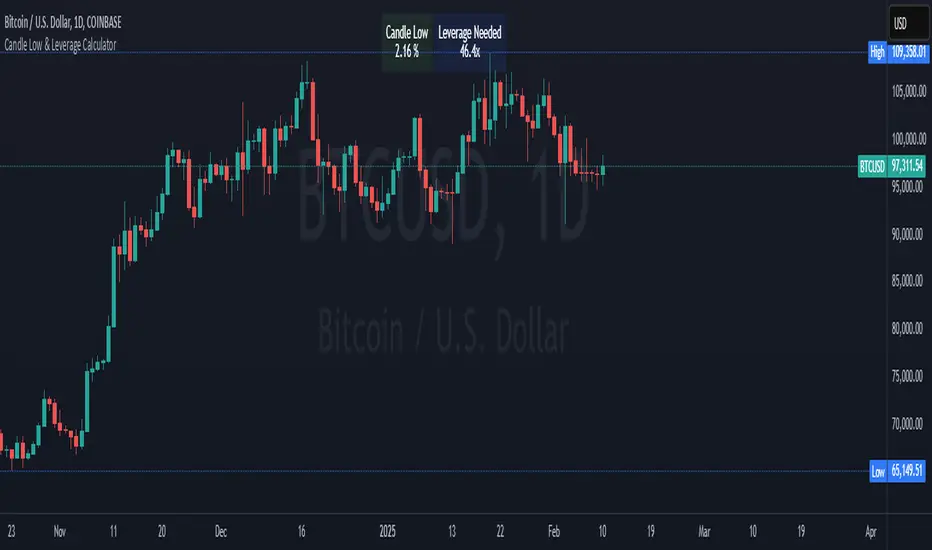
Crypto Candle Low Leverage Tracker
The Candle Low Leverage Indicator is a powerful tool for long position traders seeking to manage risk effectively when using leverage. By evaluating the current candle's low price, this indicator helps traders make more informed decisions about potential entry points, stop losses, and leverage levels. The indicator matches the low of the candle to the leverage needed for liquidation, giving you a clear view of how leverage impacts your position.
This indicator provides two critical insights:
% from Candle Low: Tracks how much the price has moved from the low of the current candle. For long position traders, this percentage is crucial for understanding how far the price has come off the low and deciding whether it’s safe to enter a position or if further price action is needed.
Leverage Needed: Estimates the leverage required to reach the candle's low as the liquidation price. Long traders can use this information to adjust leverage to a safer level, ensuring they don’t overexpose themselves to liquidation risks by matching leverage to the candle’s low.
Key Features:
Customizable table positioning (top, middle, bottom).
Toggle options to show/hide % from Candle Low and Leverage Needed.
Visual indicators with color changes: green for positive change, red for negative change, and blue for leverage requirements.
Ideal for long traders, this tool helps evaluate market conditions, manage risks, and calculate the best leverage to use in long trades, ensuring that leverage aligns with the candle’s low to prevent unnecessary liquidations.
릴리즈 노트
Bug Fixed 릴리즈 노트
Bug Fixed오픈 소스 스크립트
트레이딩뷰의 진정한 정신에 따라, 이 스크립트의 작성자는 이를 오픈소스로 공개하여 트레이더들이 기능을 검토하고 검증할 수 있도록 했습니다. 작성자에게 찬사를 보냅니다! 이 코드는 무료로 사용할 수 있지만, 코드를 재게시하는 경우 하우스 룰이 적용된다는 점을 기억하세요.
면책사항
해당 정보와 게시물은 금융, 투자, 트레이딩 또는 기타 유형의 조언이나 권장 사항으로 간주되지 않으며, 트레이딩뷰에서 제공하거나 보증하는 것이 아닙니다. 자세한 내용은 이용 약관을 참조하세요.
오픈 소스 스크립트
트레이딩뷰의 진정한 정신에 따라, 이 스크립트의 작성자는 이를 오픈소스로 공개하여 트레이더들이 기능을 검토하고 검증할 수 있도록 했습니다. 작성자에게 찬사를 보냅니다! 이 코드는 무료로 사용할 수 있지만, 코드를 재게시하는 경우 하우스 룰이 적용된다는 점을 기억하세요.
면책사항
해당 정보와 게시물은 금융, 투자, 트레이딩 또는 기타 유형의 조언이나 권장 사항으로 간주되지 않으며, 트레이딩뷰에서 제공하거나 보증하는 것이 아닙니다. 자세한 내용은 이용 약관을 참조하세요.