INVITE-ONLY SCRIPT
ETH MVRV Z Score
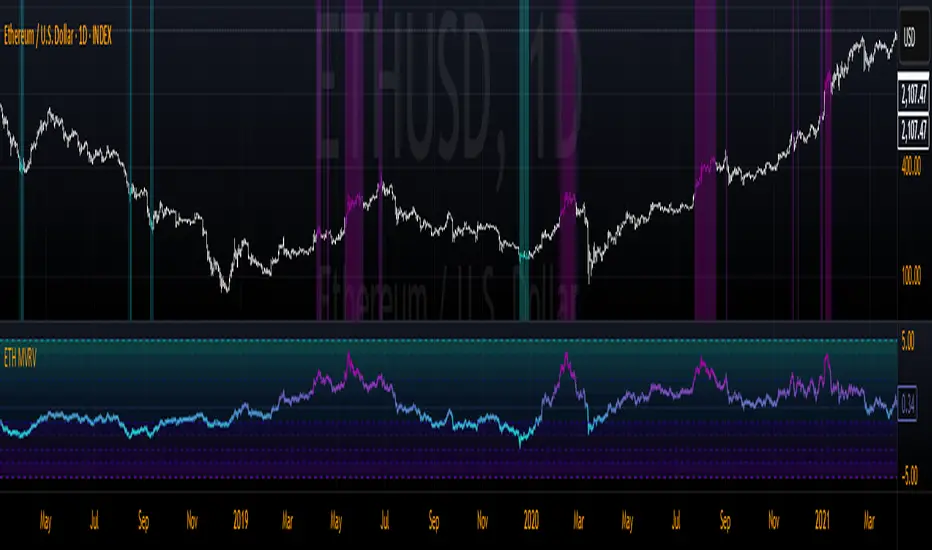
The ETH MVRV Z Score indicator is designed to help traders and investors analyze Ethereum's Market Value to Realized Value (MVRV) ratio through a standardized Z-score lens. This tool provides insights into potential overbought or oversold conditions in ETH's market by comparing the MVRV ratio to its historical statistical behavior.
The indicator calculates the Z-score of the MVRV ratio over a user-defined lookback period, visually representing how far the current MVRV deviates from its mean in terms of standard deviations. It features customizable overbought and oversold thresholds, a gradient-based color system for easy interpretation, and optional chart coloring to highlight key market conditions. Horizontal lines and filled zones provide additional context for interpreting the Z-score levels, ranging from extreme undervaluation to extreme overvaluation.
Key Features:
Inputs:
How to Use:
A Z-score above the overbought threshold (e.g., 2) may suggest ETH is overvalued, potentially signaling a selling opportunity.
A Z-score below the oversold threshold (e.g., -2) may indicate undervaluation, potentially signaling a buying opportunity.
The gradient and optional chart colors help quickly identify market conditions, while the horizontal lines provide reference points for extreme deviations.
Best For:
The indicator calculates the Z-score of the MVRV ratio over a user-defined lookback period, visually representing how far the current MVRV deviates from its mean in terms of standard deviations. It features customizable overbought and oversold thresholds, a gradient-based color system for easy interpretation, and optional chart coloring to highlight key market conditions. Horizontal lines and filled zones provide additional context for interpreting the Z-score levels, ranging from extreme undervaluation to extreme overvaluation.
Key Features:
- Z-Score Calculation: Measures the deviation of ETH’s MVRV ratio from its historical average, normalized by standard deviation.
- Customizable Settings: Adjust the lookback length for the Z-score calculation, as well as overbought and oversold thresholds.
- Color Gradient: Visualizes the Z-score with a smooth gradient, transitioning between user-defined colors for oversold, neutral, and overbought states.
- Optional Chart Colors: When enabled, applies dynamic coloring to candlesticks and backgrounds based on the Z-score, enhancing visual analysis.
- Horizontal Levels: Displays predefined Z-score levels (from -5 to 5) with shaded zones to mark significant thresholds.
Inputs:
- Z Length: The lookback period for calculating the Z-score (default: 150).
- Overbought Z Score: The threshold above which ETH is considered overbought (default: 2).
- Oversold Z Score: The threshold below which ETH is considered oversold (default: -2).
- Chart Colors: Toggle to enable/disable dynamic candlestick and background coloring.
- Color Options: Customize colors for oversold, overbought, and neutral zones.
How to Use:
A Z-score above the overbought threshold (e.g., 2) may suggest ETH is overvalued, potentially signaling a selling opportunity.
A Z-score below the oversold threshold (e.g., -2) may indicate undervaluation, potentially signaling a buying opportunity.
The gradient and optional chart colors help quickly identify market conditions, while the horizontal lines provide reference points for extreme deviations.
Best For:
- Long-term investors assessing ETH’s valuation.
- Traders looking for mean-reversion opportunities.
- Analysts combining on-chain metrics with technical analysis.
초대 전용 스크립트
이 스크립트는 작성자가 승인한 사용자만 접근할 수 있습니다. 사용하려면 요청 후 승인을 받아야 하며, 일반적으로 결제 후에 허가가 부여됩니다. 자세한 내용은 아래 작성자의 안내를 따르거나 MarktQuant에게 직접 문의하세요.
이 비공개 초대 전용 스크립트는 스크립트 모더레이터의 검토를 거치지 않았으며, 하우스 룰 준수 여부는 확인되지 않았습니다. 트레이딩뷰는 스크립트의 작동 방식을 충분히 이해하고 작성자를 완전히 신뢰하지 않는 이상, 해당 스크립트에 비용을 지불하거나 사용하는 것을 권장하지 않습니다. 커뮤니티 스크립트에서 무료 오픈소스 대안을 찾아보실 수도 있습니다.
작성자 지시 사항
Included in Basic and Premium MarktQuant memberships—enjoy analyzing trends and spotting key levels! https://marktquant.com/products/membership
🔍 Access Investing Strategies & Indicators
📊 whop.com/marktquant
🌐 marktquant.com
Nothing shared on this page constitutes financial advice. All information, tools, and analyses are provided solely for informational and educational purposes.
📊 whop.com/marktquant
🌐 marktquant.com
Nothing shared on this page constitutes financial advice. All information, tools, and analyses are provided solely for informational and educational purposes.
면책사항
해당 정보와 게시물은 금융, 투자, 트레이딩 또는 기타 유형의 조언이나 권장 사항으로 간주되지 않으며, 트레이딩뷰에서 제공하거나 보증하는 것이 아닙니다. 자세한 내용은 이용 약관을 참조하세요.