OPEN-SOURCE SCRIPT
Global vs National Index Spread RSI
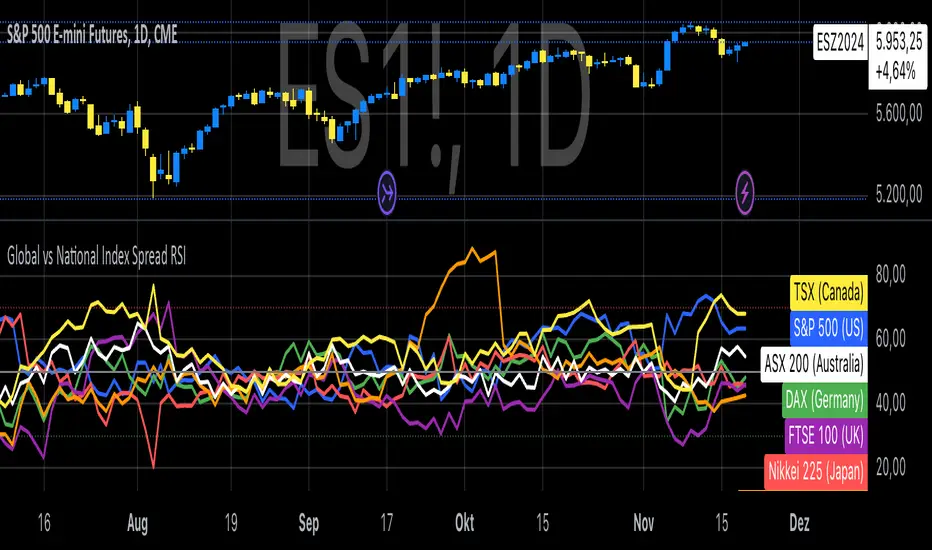
The Global vs National Index Spread RSI indicator visualizes the relative strength of national stock indices compared to a global benchmark (e.g., AMEX). It calculates the percentage spread between the closing prices of each national index and the global index, applying the Relative Strength Index (RSI) to each spread.
How It Works
Spread Calculation: The spread represents the percentage difference between a national index and the global index.
RSI Application: RSI is applied to these spreads to identify overbought or oversold conditions in the relative performance of the national indices.
Reference Lines: Overbought (70), oversold (30), and neutral (50) levels help guide interpretation.
Insights from Research
The correlation between global and national indices provides insights into market integration and interdependence. Studies such as Forbes & Rigobon (2002) emphasize the importance of understanding these linkages during periods of financial contagion. Observing spread trends with RSI can aid in identifying shifts in investor sentiment and regional performance anomalies.
Use Cases
- Detect divergences between national and global markets.
- Identify overbought or oversold conditions for specific indices.
- Complement portfolio management strategies by monitoring geographic performance.
References
Forbes, K. J., & Rigobon, R. (2002). "No contagion, only interdependence: Measuring stock market co-movements." Journal of Finance.
Eun, C. S., & Shim, S. (1989). "International transmission of stock market movements." Journal of Financial and Quantitative Analysis.
오픈 소스 스크립트
트레이딩뷰의 진정한 정신에 따라, 이 스크립트의 작성자는 이를 오픈소스로 공개하여 트레이더들이 기능을 검토하고 검증할 수 있도록 했습니다. 작성자에게 찬사를 보냅니다! 이 코드는 무료로 사용할 수 있지만, 코드를 재게시하는 경우 하우스 룰이 적용된다는 점을 기억하세요.
Where others speculate, we systematize.
edgetools.org
edgetools.org
면책사항
해당 정보와 게시물은 금융, 투자, 트레이딩 또는 기타 유형의 조언이나 권장 사항으로 간주되지 않으며, 트레이딩뷰에서 제공하거나 보증하는 것이 아닙니다. 자세한 내용은 이용 약관을 참조하세요.