OPEN-SOURCE SCRIPT
업데이트됨 Cross Alert with Configurable Rectangles
**Description:**
This TradingView script, **"Cross Alert with Configurable Rectangles"**, is a technical analysis tool designed to help traders visualize and analyze market trends effectively. It combines configurable moving averages with customizable timeframe-based rectangles for highlighting price ranges.
### Features:
1. **Moving Averages:**
- Calculates and plots an Exponential Moving Average (EMA) and a Simple Moving Average (SMA) based on user-defined lengths.
- Provides both short and long moving averages to identify potential trend reversals or confirmations.
2. **Customizable Timeframe Rectangles:**
- Dynamically draws rectangles around price action based on user-selected timeframes: **Hourly (60 minutes), Daily, Weekly, or Monthly.**
- Automatically updates the rectangles to reflect high and low price levels within the selected timeframe.
- Customizable rectangle color and transparency for better chart visibility.
3. **Dynamic Line Projections:**
- Projects the trend of the long and short moving averages forward in time to help anticipate price movements.
### Use Case:
This script is ideal for traders who want to:
- Identify key support and resistance levels within different timeframes.
- Analyze price behavior relative to moving averages.
- Spot potential trend changes by observing price interaction with the moving averages and timeframe rectangles.
The script is fully configurable, allowing traders to adapt it to their trading strategy and preferences.
릴리즈 노트
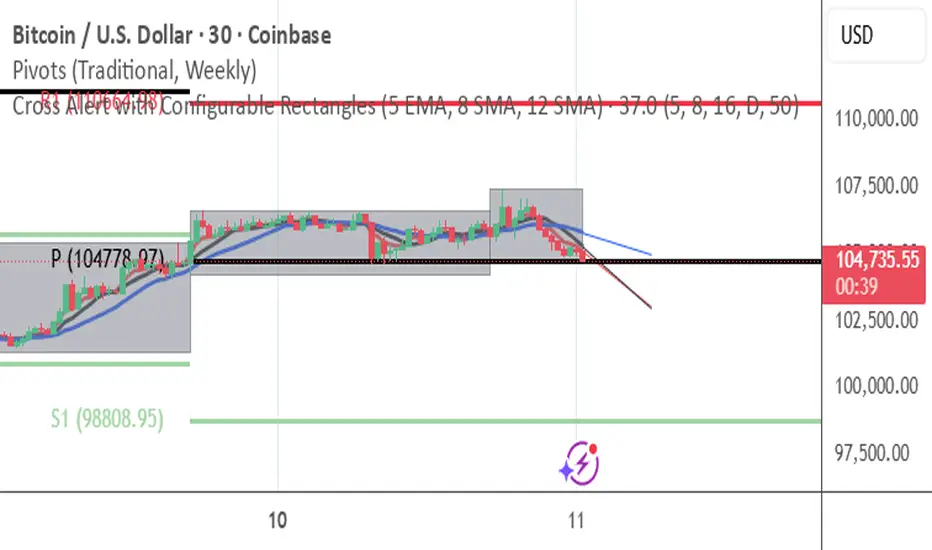
**Description for the Script (TradingView / Pine Script v5):**This TradingView indicator overlays three moving averages — a **5-period EMA**, an **8-period SMA**, and a **12-period SMA** — on the chart and visually tracks market structure using dynamic rectangles drawn for each selected timeframe (hourly, daily, weekly, or monthly).
The rectangles automatically update to highlight price ranges for the current chosen period, expanding as new highs and lows form, then resetting at each timeframe change.
In addition, the script projects short-term forward extensions of each moving average line to help visualize momentum and potential future direction.
**Core Features:**
* 5-EMA, 8-SMA, and 12-SMA displayed simultaneously for short-term and medium-term trend tracking.
* Auto-updating rectangles that outline the high-low range of each chosen timeframe (configurable between 1H, 1D, 1W, 1M).
* Customizable rectangle color and transparency.
* Forward-projected lines for all three moving averages to visualize slope and momentum.
**Intended Use:**
This tool is designed for traders who want a clean visual representation of short-term trend strength and structure boundaries, combining multiple moving averages with dynamic range mapping. It’s particularly useful for identifying trend confluence, breakout zones, and momentum shifts in real time.
오픈 소스 스크립트
트레이딩뷰의 진정한 정신에 따라, 이 스크립트의 작성자는 이를 오픈소스로 공개하여 트레이더들이 기능을 검토하고 검증할 수 있도록 했습니다. 작성자에게 찬사를 보냅니다! 이 코드는 무료로 사용할 수 있지만, 코드를 재게시하는 경우 하우스 룰이 적용된다는 점을 기억하세요.
면책사항
해당 정보와 게시물은 금융, 투자, 트레이딩 또는 기타 유형의 조언이나 권장 사항으로 간주되지 않으며, 트레이딩뷰에서 제공하거나 보증하는 것이 아닙니다. 자세한 내용은 이용 약관을 참조하세요.
오픈 소스 스크립트
트레이딩뷰의 진정한 정신에 따라, 이 스크립트의 작성자는 이를 오픈소스로 공개하여 트레이더들이 기능을 검토하고 검증할 수 있도록 했습니다. 작성자에게 찬사를 보냅니다! 이 코드는 무료로 사용할 수 있지만, 코드를 재게시하는 경우 하우스 룰이 적용된다는 점을 기억하세요.
면책사항
해당 정보와 게시물은 금융, 투자, 트레이딩 또는 기타 유형의 조언이나 권장 사항으로 간주되지 않으며, 트레이딩뷰에서 제공하거나 보증하는 것이 아닙니다. 자세한 내용은 이용 약관을 참조하세요.