OPEN-SOURCE SCRIPT
Candle Size with Moving Averages and Alerts
Overview
The "Candle Size with Moving Averages and Alerts" indicator is designed to provide traders with a visual representation of the size of each candle. This is useful for identifying periods of high volatility or significant price movements. The indicator also offers moving averages of the candle sizes and customizable alert thresholds to notify traders of unusually large or small candles.
Key Features
How to Use the Indicator
Adding the Indicator to Your Chart
Open TradingView and navigate to your chart.
Click on the "Indicators" button at the top of the chart.
Search for "Candle Size with Moving Averages and Alerts."
Click on the indicator to add it to your chart.
Customizing the Indicator
Once the indicator is added to your chart, click on the settings icon (gear icon) next to the indicator's name in the chart legend.
This will open the settings panel where you can customize various parameters of the indicator.
Settings and Parameters
Show Moving Averages
Checkbox: Enable or disable the display of moving averages on the candle size plot.
MA Length 1
Input: Set the length of the first moving average (default is 14).
MA Length 2
Input: Set the length of the second moving average (default is 28).
Alert Threshold
Input: Define the threshold for alerts as a multiple of the average candle size (default is 1.5).
MA Color 1
Color Picker: Choose the color for the first moving average (default is blue).
MA Color 2
Color Picker: Choose the color for the second moving average (default is red).
Candle Size Color
Color Picker: Choose the color for the candle size plot (default is green).
Alert Threshold Color
Color Picker: Choose the color for the alert thresholds (default is orange).
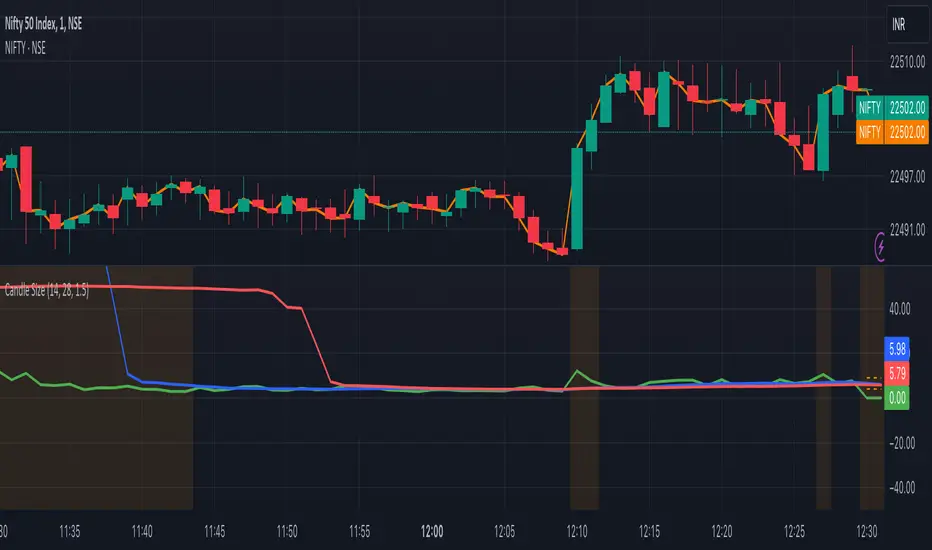
Understanding the Plots
Candle Size Plot
The main plot shows the size of each candle (high minus low) in green by default.
This helps you visualize the volatility and identify significant price movements.
Moving Averages
If enabled, two moving averages are plotted on the candle size chart to help you understand the average candle size over different periods.
MA 1 (blue by default) and MA 2 (red by default) provide a smoothed view of the candle sizes.
Alert Thresholds
The upper and lower thresholds are plotted as dashed lines (orange by default).
The upper threshold indicates an unusually large candle size, while the lower threshold indicates an unusually small candle size.
Alerts and Background Colors
When the candle size exceeds the upper threshold, an alert is triggered, and the background color changes to a semi-transparent orange.
When the candle size falls below the lower threshold, an alert is triggered, and the background color changes to a semi-transparent orange.
These visual cues help you quickly identify significant candle sizes.
Example Settings
MA Length 1: 14
MA Length 2: 28
Alert Threshold: 1.5
MA Color 1: Blue
MA Color 2: Red
Candle Size Color: Green
Alert Threshold Color: Orange
The "Candle Size with Moving Averages and Alerts" indicator is designed to provide traders with a visual representation of the size of each candle. This is useful for identifying periods of high volatility or significant price movements. The indicator also offers moving averages of the candle sizes and customizable alert thresholds to notify traders of unusually large or small candles.
Key Features
- []Candle Size Plot: Displays the size of each candle on a separate panel.
[]Moving Averages: Optionally plot moving averages of the candle sizes with customizable lengths and colors.
[]Alert Thresholds: Define thresholds to get alerted when candle sizes are unusually large or small.
[]Customizable Colors: Choose colors for different elements of the indicator. - Alerts: Visual and background color alerts for significant candle sizes.
How to Use the Indicator
Adding the Indicator to Your Chart
Open TradingView and navigate to your chart.
Click on the "Indicators" button at the top of the chart.
Search for "Candle Size with Moving Averages and Alerts."
Click on the indicator to add it to your chart.
Customizing the Indicator
Once the indicator is added to your chart, click on the settings icon (gear icon) next to the indicator's name in the chart legend.
This will open the settings panel where you can customize various parameters of the indicator.
Settings and Parameters
Show Moving Averages
Checkbox: Enable or disable the display of moving averages on the candle size plot.
MA Length 1
Input: Set the length of the first moving average (default is 14).
MA Length 2
Input: Set the length of the second moving average (default is 28).
Alert Threshold
Input: Define the threshold for alerts as a multiple of the average candle size (default is 1.5).
MA Color 1
Color Picker: Choose the color for the first moving average (default is blue).
MA Color 2
Color Picker: Choose the color for the second moving average (default is red).
Candle Size Color
Color Picker: Choose the color for the candle size plot (default is green).
Alert Threshold Color
Color Picker: Choose the color for the alert thresholds (default is orange).
Understanding the Plots
Candle Size Plot
The main plot shows the size of each candle (high minus low) in green by default.
This helps you visualize the volatility and identify significant price movements.
Moving Averages
If enabled, two moving averages are plotted on the candle size chart to help you understand the average candle size over different periods.
MA 1 (blue by default) and MA 2 (red by default) provide a smoothed view of the candle sizes.
Alert Thresholds
The upper and lower thresholds are plotted as dashed lines (orange by default).
The upper threshold indicates an unusually large candle size, while the lower threshold indicates an unusually small candle size.
Alerts and Background Colors
When the candle size exceeds the upper threshold, an alert is triggered, and the background color changes to a semi-transparent orange.
When the candle size falls below the lower threshold, an alert is triggered, and the background color changes to a semi-transparent orange.
These visual cues help you quickly identify significant candle sizes.
Example Settings
MA Length 1: 14
MA Length 2: 28
Alert Threshold: 1.5
MA Color 1: Blue
MA Color 2: Red
Candle Size Color: Green
Alert Threshold Color: Orange
오픈 소스 스크립트
트레이딩뷰의 진정한 정신에 따라, 이 스크립트의 작성자는 이를 오픈소스로 공개하여 트레이더들이 기능을 검토하고 검증할 수 있도록 했습니다. 작성자에게 찬사를 보냅니다! 이 코드는 무료로 사용할 수 있지만, 코드를 재게시하는 경우 하우스 룰이 적용된다는 점을 기억하세요.
면책사항
해당 정보와 게시물은 금융, 투자, 트레이딩 또는 기타 유형의 조언이나 권장 사항으로 간주되지 않으며, 트레이딩뷰에서 제공하거나 보증하는 것이 아닙니다. 자세한 내용은 이용 약관을 참조하세요.
오픈 소스 스크립트
트레이딩뷰의 진정한 정신에 따라, 이 스크립트의 작성자는 이를 오픈소스로 공개하여 트레이더들이 기능을 검토하고 검증할 수 있도록 했습니다. 작성자에게 찬사를 보냅니다! 이 코드는 무료로 사용할 수 있지만, 코드를 재게시하는 경우 하우스 룰이 적용된다는 점을 기억하세요.
면책사항
해당 정보와 게시물은 금융, 투자, 트레이딩 또는 기타 유형의 조언이나 권장 사항으로 간주되지 않으며, 트레이딩뷰에서 제공하거나 보증하는 것이 아닙니다. 자세한 내용은 이용 약관을 참조하세요.