OPEN-SOURCE SCRIPT
Dynamic Square Levels
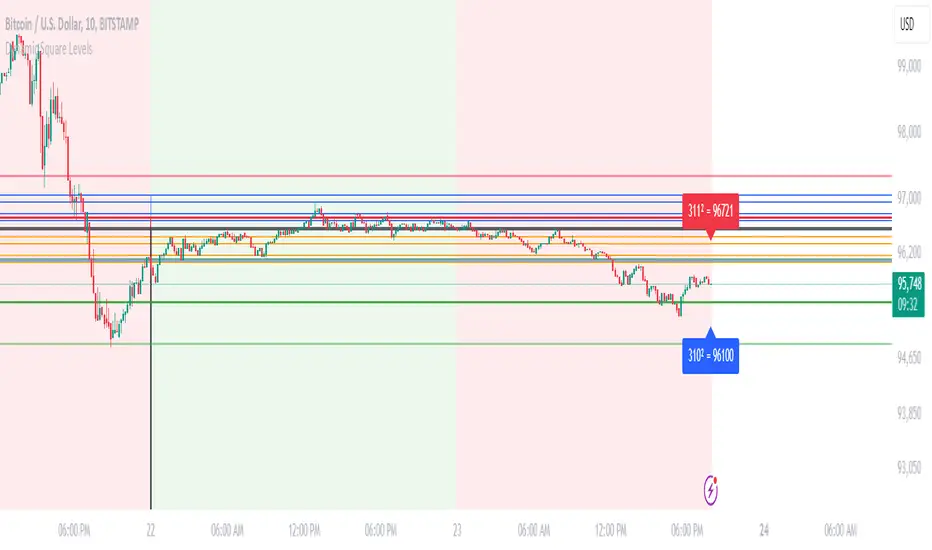
**Dynamic Square Levels with Strict Range Condition**
This script is designed to help traders visualize dynamic price levels based on the square root of the current price. It calculates key levels above and below the current price, providing a clear view of potential support and resistance zones. The script is highly customizable, allowing you to adjust the number of levels, line styles, and label settings to suit your trading strategy.
---
### **Key Features**:
1. **Dynamic Square Levels**:
- Calculates price levels based on the square root of the current price.
- Plots levels above and below the current price for better market context.
2. **Range Condition**:
- Lines are only drawn when the current price is closer to the base level (`square(base_n)`) than to the next level (`square(base_n + 1)`).
- Ensures levels are only visible when they are most relevant.
3. **Customizable Levels**:
- Choose the number of levels to plot (up to 20 levels).
- Toggle additional levels (e.g., 0.25, 0.5, 0.75) for more granular analysis.
4. **Line and Label Customization**:
- Adjust line width, style (solid, dashed, dotted), and extend direction (left, right, both, or none).
- Customize label text, size, and position for better readability.
5. **Background Highlight**:
- Highlights the background when the current price is closer to the base level, providing a visual cue for key price zones.
---
### **How It Works**:
- The script calculates the square root of the current price and uses it to generate dynamic levels.
- Levels are plotted above and below the current price, with customizable spacing.
- Lines and labels are only drawn when the current price is within a specific range, ensuring clean and relevant visuals.
---
### **Why Use This Script?**:
- **Clear Visuals**: Easily identify key support and resistance levels.
- **Customizable**: Tailor the script to your trading style with adjustable settings.
- **Efficient**: Levels are only drawn when relevant, avoiding clutter on your chart.
---
### **Settings**:
1. **Price Type**: Choose the price source (Open, High, Low, Close, HL2, HLC3, HLCC4).
2. **Number of Levels**: Set the number of levels to plot (1 to 20).
3. **Line Style**: Choose between solid, dashed, or dotted lines.
4. **Line Width**: Adjust the thickness of the lines (1 to 5).
5. **Label Settings**: Customize label text, size, and position.
---
### **Perfect For**:
- Traders who rely on dynamic support and resistance levels.
- Those who prefer clean and customizable chart visuals.
- Anyone looking to enhance their price action analysis.
---
**Get started today and take your trading to the next level with Dynamic Square Levels!** 🚀
오픈 소스 스크립트
트레이딩뷰의 진정한 정신에 따라, 이 스크립트의 작성자는 이를 오픈소스로 공개하여 트레이더들이 기능을 검토하고 검증할 수 있도록 했습니다. 작성자에게 찬사를 보냅니다! 이 코드는 무료로 사용할 수 있지만, 코드를 재게시하는 경우 하우스 룰이 적용된다는 점을 기억하세요.
면책사항
해당 정보와 게시물은 금융, 투자, 트레이딩 또는 기타 유형의 조언이나 권장 사항으로 간주되지 않으며, 트레이딩뷰에서 제공하거나 보증하는 것이 아닙니다. 자세한 내용은 이용 약관을 참조하세요.
오픈 소스 스크립트
트레이딩뷰의 진정한 정신에 따라, 이 스크립트의 작성자는 이를 오픈소스로 공개하여 트레이더들이 기능을 검토하고 검증할 수 있도록 했습니다. 작성자에게 찬사를 보냅니다! 이 코드는 무료로 사용할 수 있지만, 코드를 재게시하는 경우 하우스 룰이 적용된다는 점을 기억하세요.
면책사항
해당 정보와 게시물은 금융, 투자, 트레이딩 또는 기타 유형의 조언이나 권장 사항으로 간주되지 않으며, 트레이딩뷰에서 제공하거나 보증하는 것이 아닙니다. 자세한 내용은 이용 약관을 참조하세요.