OPEN-SOURCE SCRIPT
업데이트됨 INDIA/NIFTY DOWN DAY MARKER
INDIA/NIFTY DOWN DAY MARKER is indicator designed for Indian investors that provides visual cues on whole universe of stock charts marking volatile days based on the performance of selected Indian market indices. This indicator helps traders and investors assess the relative strength of individual stocks during extreme market movements
Key Features:
1) Index Selection: Users can choose from four major Indian indices: Nifty 50, Nifty Midcap 100, Nifty Smallcap 100, and Nifty MIDSMALLCAP 400. This flexibility allows for tailored analysis based on market focus.
2) Customizable Thresholds: Users can set their desired percentage thresholds for both rise and fall days, with default values of 2%. This customization enables users to adapt the indicator to their trading strategies.
3) Visual Indicators:
Rise Days: When the selected index rises by the specified percentage, the chart background turns green, indicating a bullish trend.
Fall Days: Conversely, if the index falls by the defined percentage, the background changes to red, signaling a bearish trend.
릴리즈 노트
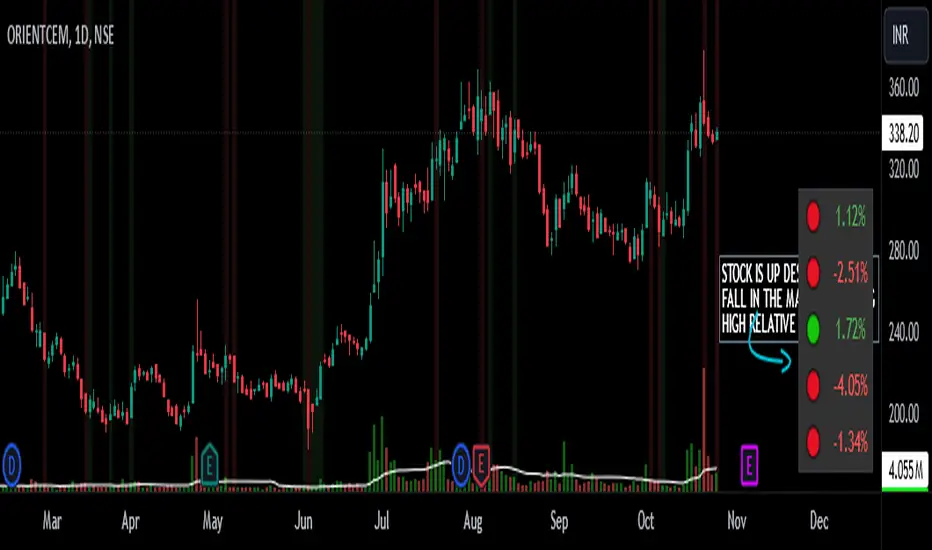
This script basically allows you to mark the days on all charts when markets are extremely volatile. The aim is to check the relative strength of a stock on days when markets are in panic.
If a stock is rising while the whole market has fallen, this shows higher strength and potential for a big upmove in the upcoming days. This ensures you trade only strongest stocks.
Example: You can mark the day when Nifty falls or rises by, let’s say, 1.5%. This allows you to check the behavior of the stock on that day.
Also, a table has been added, showing the percentage change of the stock on marked days. This allows you to easily check the stock's performance.
Features:
- Can mark both up and down days on the desired index.
- Customize value on index fall or rise.
- Option to mark up days in the index (by default turned off).
- Enable dates on tables if desired.
- Supports both dark mode and normal mode.
- Select the number of days to be displayed on the table.
The green symbol in the first column of the table shows that the index rose by the specified percentage on that day, whereas the red symbolizes fall days.
The last column shows the performance of the particular stock on that day.
Tip: Disable coloring on the charts if it is distracting; you can use the table only. To do this, simply go to settings, then style, and uncheck the background color boxes.
오픈 소스 스크립트
진정한 트레이딩뷰 정신에 따라 이 스크립트 작성자는 트레이더가 기능을 검토하고 검증할 수 있도록 오픈소스로 공개했습니다. 작성자에게 찬사를 보냅니다! 무료로 사용할 수 있지만 코드를 다시 게시할 경우 하우스 룰이 적용된다는 점을 기억하세요.
면책사항
이 정보와 게시물은 TradingView에서 제공하거나 보증하는 금융, 투자, 거래 또는 기타 유형의 조언이나 권고 사항을 의미하거나 구성하지 않습니다. 자세한 내용은 이용 약관을 참고하세요.
오픈 소스 스크립트
진정한 트레이딩뷰 정신에 따라 이 스크립트 작성자는 트레이더가 기능을 검토하고 검증할 수 있도록 오픈소스로 공개했습니다. 작성자에게 찬사를 보냅니다! 무료로 사용할 수 있지만 코드를 다시 게시할 경우 하우스 룰이 적용된다는 점을 기억하세요.
면책사항
이 정보와 게시물은 TradingView에서 제공하거나 보증하는 금융, 투자, 거래 또는 기타 유형의 조언이나 권고 사항을 의미하거나 구성하지 않습니다. 자세한 내용은 이용 약관을 참고하세요.