OPEN-SOURCE SCRIPT
Steinkopff Steigung
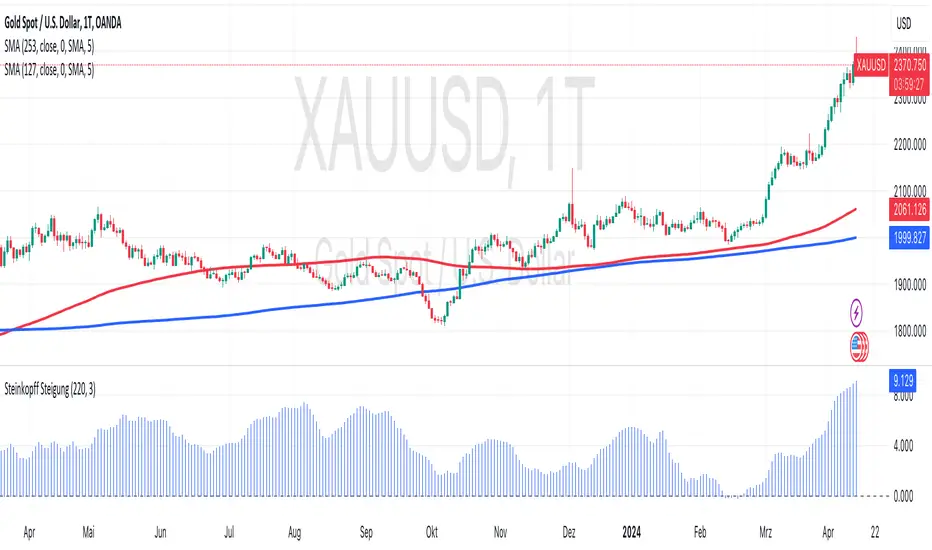
The "Steinkopff Slope" indicator is a custom tool for TradingView designed to measure and visually represent the percentage slope of a moving average. This indicator is particularly useful for analyzing the momentum of a financial instrument by highlighting changes in the slope of the moving average.
Initially, the indicator allows the user to define the length of the moving average to be used as the basis for the calculation. This input is set to 220 periods by default but can be adjusted according to the user's preference. The moving average itself is calculated based on the closing prices.
The core functionality of the indicator is to calculate the percentage slope of the moving average. This is achieved by determining the change in the moving average between the current period and the previous period and expressing this change relative to the value of the previous period. The result is then scaled by a factor of 10,000 to derive a percentage slope.
To refine the results and smooth out potential outliers, the indicator additionally performs a smoothing of the calculated slope. The user can adjust the length of this smoothing through another input parameter, which is set to 3 periods by default. The smoothed slope is finally displayed as a histogram in blue, with the line thickness set to 1.
A horizontal line at zero (displayed in gray) serves as a reference point to visually distinguish between positive and negative slopes. This helps traders and analysts identify trends: a slope above the zero line indicates a positive trend, while a slope below the zero line signals a negative trend.
In summary, the "Steinkopff Slope" indicator provides a simple yet effective way to understand the momentum and direction of a trend by analyzing and visualizing changes in the slope of a moving average over a definable period.
오픈 소스 스크립트
트레이딩뷰의 진정한 정신에 따라, 이 스크립트의 작성자는 이를 오픈소스로 공개하여 트레이더들이 기능을 검토하고 검증할 수 있도록 했습니다. 작성자에게 찬사를 보냅니다! 이 코드는 무료로 사용할 수 있지만, 코드를 재게시하는 경우 하우스 룰이 적용된다는 점을 기억하세요.
면책사항
해당 정보와 게시물은 금융, 투자, 트레이딩 또는 기타 유형의 조언이나 권장 사항으로 간주되지 않으며, 트레이딩뷰에서 제공하거나 보증하는 것이 아닙니다. 자세한 내용은 이용 약관을 참조하세요.
오픈 소스 스크립트
트레이딩뷰의 진정한 정신에 따라, 이 스크립트의 작성자는 이를 오픈소스로 공개하여 트레이더들이 기능을 검토하고 검증할 수 있도록 했습니다. 작성자에게 찬사를 보냅니다! 이 코드는 무료로 사용할 수 있지만, 코드를 재게시하는 경우 하우스 룰이 적용된다는 점을 기억하세요.
면책사항
해당 정보와 게시물은 금융, 투자, 트레이딩 또는 기타 유형의 조언이나 권장 사항으로 간주되지 않으며, 트레이딩뷰에서 제공하거나 보증하는 것이 아닙니다. 자세한 내용은 이용 약관을 참조하세요.