OPEN-SOURCE SCRIPT
업데이트됨 Dynamic Intraday HLC levels [Sudeb]
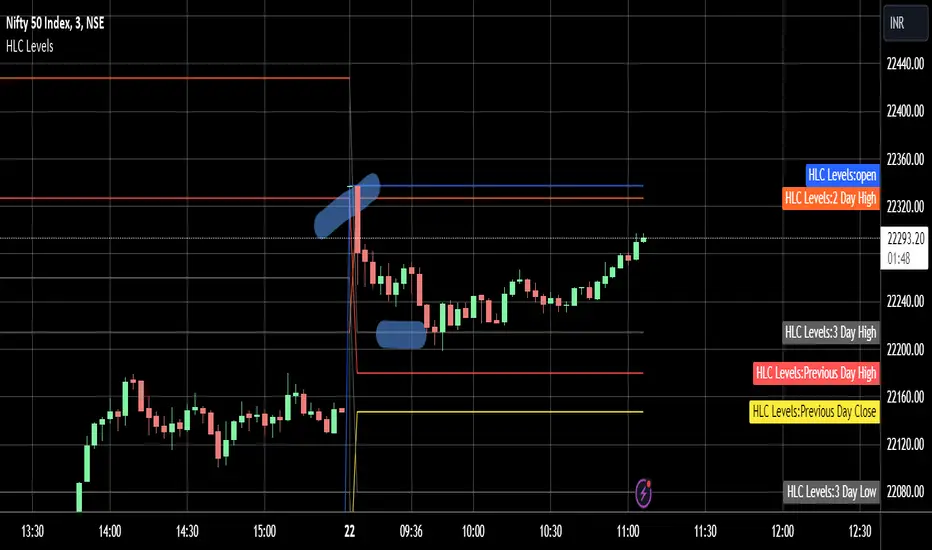
This is a simple indicator which will mark High & Low of last three days.
Close of Previous Day
The High lines will show in RED color, Low lines in green & close lines in Yellow.
The advantage of using this indicator is - It will greyed out or fade the color of any previous day level if the price is breached of that level.
For example if 2 day's ago High price is breached by 1 day's ago High, then the 2 Day's ago High level color will greyed out in current day chart. Thus giving you a confirmation whether it's a fresh or already tested levels.
릴리즈 노트
Few code modifications have been made. 릴리즈 노트
Few code updates have been made. 오픈 소스 스크립트
트레이딩뷰의 진정한 정신에 따라, 이 스크립트의 작성자는 이를 오픈소스로 공개하여 트레이더들이 기능을 검토하고 검증할 수 있도록 했습니다. 작성자에게 찬사를 보냅니다! 이 코드는 무료로 사용할 수 있지만, 코드를 재게시하는 경우 하우스 룰이 적용된다는 점을 기억하세요.
면책사항
해당 정보와 게시물은 금융, 투자, 트레이딩 또는 기타 유형의 조언이나 권장 사항으로 간주되지 않으며, 트레이딩뷰에서 제공하거나 보증하는 것이 아닙니다. 자세한 내용은 이용 약관을 참조하세요.
오픈 소스 스크립트
트레이딩뷰의 진정한 정신에 따라, 이 스크립트의 작성자는 이를 오픈소스로 공개하여 트레이더들이 기능을 검토하고 검증할 수 있도록 했습니다. 작성자에게 찬사를 보냅니다! 이 코드는 무료로 사용할 수 있지만, 코드를 재게시하는 경우 하우스 룰이 적용된다는 점을 기억하세요.
면책사항
해당 정보와 게시물은 금융, 투자, 트레이딩 또는 기타 유형의 조언이나 권장 사항으로 간주되지 않으며, 트레이딩뷰에서 제공하거나 보증하는 것이 아닙니다. 자세한 내용은 이용 약관을 참조하세요.