PROTECTED SOURCE SCRIPT
50, 100, 200 Moving Average
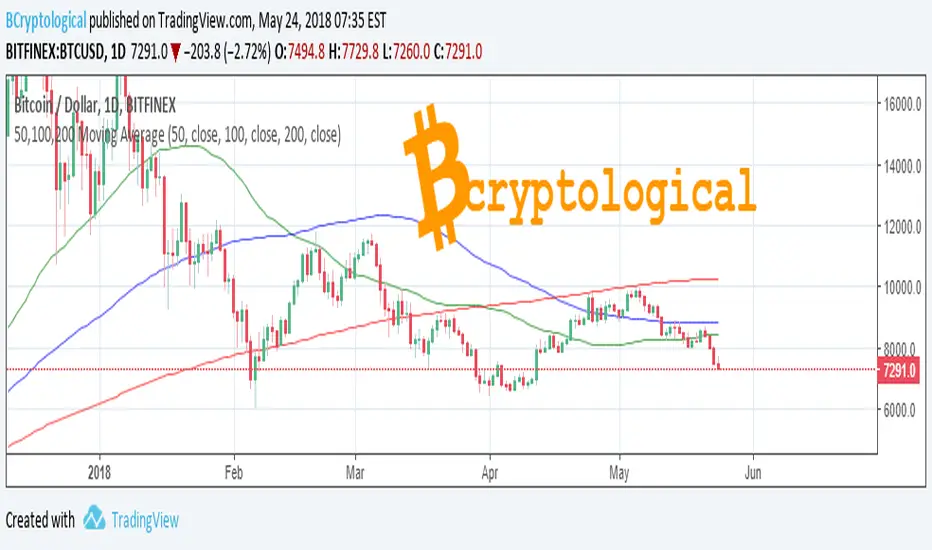
Free to use Moving Average indicator for 50, 100 and 200 days.
Smooths out the price across each period to reveal short, medium and long term trends and their relationship to each other. In principal, when the price is above a moving average the trend is up, when the price is below a moving average the trend is down.
When a short term MA crosses above a long term MA (a "golden cross") it is a strong buy signal. Conversely when a short term MA crosses below a long term MA (a "death cross") it is a strong sell signal.
Note that Moving Averages represent historical data and therefore are not strictly predictive in nature, but show trends that may be in action. Notably the 200 day MA will often be respected as support or resistance.
This tool is for educational purposes only and not a recommendation to buy or sell. Always do your own research before trading.
Best wishes,
BCryptological
보호된 스크립트입니다
이 스크립트는 비공개 소스로 게시됩니다. 하지만 이를 자유롭게 제한 없이 사용할 수 있습니다 – 자세한 내용은 여기에서 확인하세요.
면책사항
해당 정보와 게시물은 금융, 투자, 트레이딩 또는 기타 유형의 조언이나 권장 사항으로 간주되지 않으며, 트레이딩뷰에서 제공하거나 보증하는 것이 아닙니다. 자세한 내용은 이용 약관을 참조하세요.
보호된 스크립트입니다
이 스크립트는 비공개 소스로 게시됩니다. 하지만 이를 자유롭게 제한 없이 사용할 수 있습니다 – 자세한 내용은 여기에서 확인하세요.
면책사항
해당 정보와 게시물은 금융, 투자, 트레이딩 또는 기타 유형의 조언이나 권장 사항으로 간주되지 않으며, 트레이딩뷰에서 제공하거나 보증하는 것이 아닙니다. 자세한 내용은 이용 약관을 참조하세요.