OPEN-SOURCE SCRIPT
ATH/TTL & 52WH/L with Candle Coloring by RV
Importance:
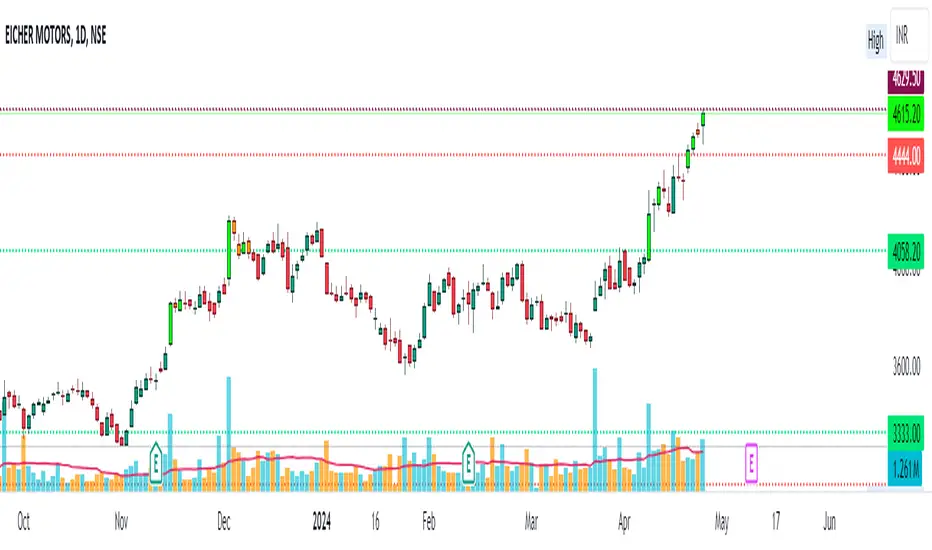
Identifying Key Price Levels: The indicator helps identify critical price levels such as all-time highs (ATH), all-time lows (ATL), 52-week highs (52WH), and 52-week lows (52WL). These levels often act as significant support or resistance areas.
Candle Color Insights: By coloring candles based on their relationship to these key levels, traders can quickly assess market sentiment and potential reversal points.
Visual Representation: The plotted lines and colored candles provide a visual representation of price dynamics, aiding in trend analysis and decision-making.
How to Use:
Key Level Confirmation: Confirm market trends or reversals by observing how price interacts with ATH, ATL, 52WH, and 52WL levels. Breakouts or bounces from these levels can signal strong buying or selling pressure.
Candle Color Signals: Pay attention to candle colors near key levels. For example, green candles above 52WH may indicate bullish momentum, while red candles below 52WL may suggest bearish pressure.
Confirmation with Other Indicators: Use this indicator in conjunction with other technical indicators or chart patterns to validate trading signals. For instance, combine it with moving averages or RSI to confirm potential entry or exit points.
Risk Management: Set stop-loss orders or take-profit levels based on the proximity of price to key levels. Tighten stops or consider profit-taking near significant levels to manage risk effectively.
Lines Plotted:
ATH Line: Represents the all-time high (ATH) levels.
ATL Line: Represents the all-time low (ATL) levels.
52WH Line: Represents the 52-week high (52WH) levels.
52WL Line: Represents the 52-week low (52WL) levels.
52WH 25% Low Line: Represents 25% below the 52-week high.
52WL 30% High Line: Represents 30% above the 52-week low.
Candle Coloring:
Candles are colored based on their relationship to ATH, ATL, 52WH, and 52WL levels.
Green: Close is above 52WH.
Orange: Close is above 52WH but lower than or equal to open.
Red: Close is below 52WL.
Cyan: Close is below 52WL but higher than or equal to open.
Additional Information:
Levels for coloring candles are dynamically calculated based on percentage differences from 52WH and 52WL.
Historical data is fetched to calculate ATH, ATL, 52WH, and 52WL levels.
The script provides a visual representation of key price levels and candle behavior relative to these levels.
오픈 소스 스크립트
트레이딩뷰의 진정한 정신에 따라, 이 스크립트의 작성자는 이를 오픈소스로 공개하여 트레이더들이 기능을 검토하고 검증할 수 있도록 했습니다. 작성자에게 찬사를 보냅니다! 이 코드는 무료로 사용할 수 있지만, 코드를 재게시하는 경우 하우스 룰이 적용된다는 점을 기억하세요.
면책사항
해당 정보와 게시물은 금융, 투자, 트레이딩 또는 기타 유형의 조언이나 권장 사항으로 간주되지 않으며, 트레이딩뷰에서 제공하거나 보증하는 것이 아닙니다. 자세한 내용은 이용 약관을 참조하세요.
오픈 소스 스크립트
트레이딩뷰의 진정한 정신에 따라, 이 스크립트의 작성자는 이를 오픈소스로 공개하여 트레이더들이 기능을 검토하고 검증할 수 있도록 했습니다. 작성자에게 찬사를 보냅니다! 이 코드는 무료로 사용할 수 있지만, 코드를 재게시하는 경우 하우스 룰이 적용된다는 점을 기억하세요.
면책사항
해당 정보와 게시물은 금융, 투자, 트레이딩 또는 기타 유형의 조언이나 권장 사항으로 간주되지 않으며, 트레이딩뷰에서 제공하거나 보증하는 것이 아닙니다. 자세한 내용은 이용 약관을 참조하세요.