OPEN-SOURCE SCRIPT
OHLC OLHC - Monthly, Weekly, Daily and Hourly
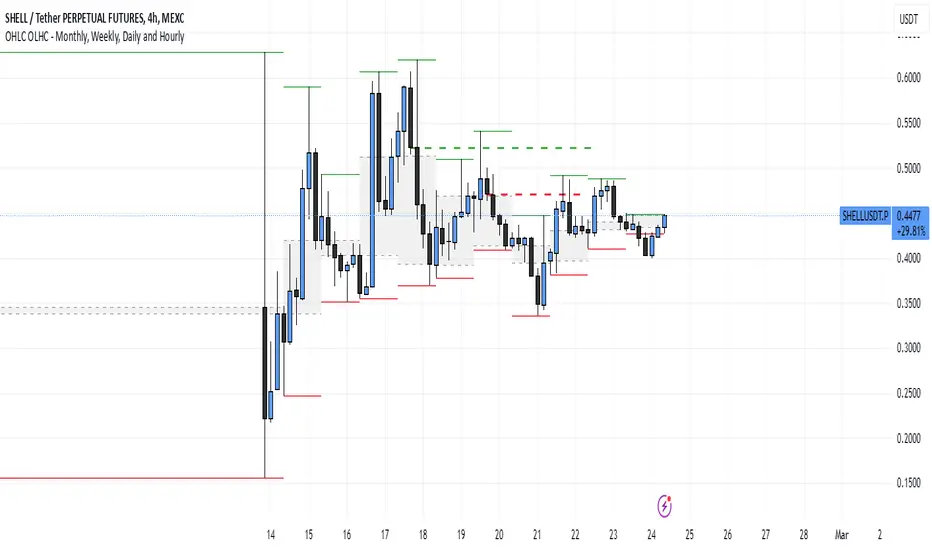
This indicator plots the previous day's (or any selected timeframe’s) Open, High, Low, and Close (OHLC) levels on the current chart. It helps traders analyze historical price levels to identify support and resistance zones.
Key Features:
Multi-Timeframe Support:
Users can select a timeframe (D, W, M, etc.) to fetch previous OHLC data.
The script requests OHLC values from the selected timeframe and overlays them on the current chart.
Customizable Display Options:
Users can choose to display only the last OHLC levels instead of all past session levels.
Users can extend the OHLC lines across the chart.
Background Highlighting:
The script fills the background only for the Previous Open and Previous Close levels, making them visually distinct.
Previous High and Low levels do not have background color.
This script is particularly useful for day traders and swing traders who rely on key price levels to make trading decisions. Let me know if you need further refinements!
오픈 소스 스크립트
트레이딩뷰의 진정한 정신에 따라, 이 스크립트의 작성자는 이를 오픈소스로 공개하여 트레이더들이 기능을 검토하고 검증할 수 있도록 했습니다. 작성자에게 찬사를 보냅니다! 이 코드는 무료로 사용할 수 있지만, 코드를 재게시하는 경우 하우스 룰이 적용된다는 점을 기억하세요.
면책사항
해당 정보와 게시물은 금융, 투자, 트레이딩 또는 기타 유형의 조언이나 권장 사항으로 간주되지 않으며, 트레이딩뷰에서 제공하거나 보증하는 것이 아닙니다. 자세한 내용은 이용 약관을 참조하세요.
오픈 소스 스크립트
트레이딩뷰의 진정한 정신에 따라, 이 스크립트의 작성자는 이를 오픈소스로 공개하여 트레이더들이 기능을 검토하고 검증할 수 있도록 했습니다. 작성자에게 찬사를 보냅니다! 이 코드는 무료로 사용할 수 있지만, 코드를 재게시하는 경우 하우스 룰이 적용된다는 점을 기억하세요.
면책사항
해당 정보와 게시물은 금융, 투자, 트레이딩 또는 기타 유형의 조언이나 권장 사항으로 간주되지 않으며, 트레이딩뷰에서 제공하거나 보증하는 것이 아닙니다. 자세한 내용은 이용 약관을 참조하세요.