PROTECTED SOURCE SCRIPT
업데이트됨 CRT Trades (turtle soup, A-M-D ranges with inside bars)
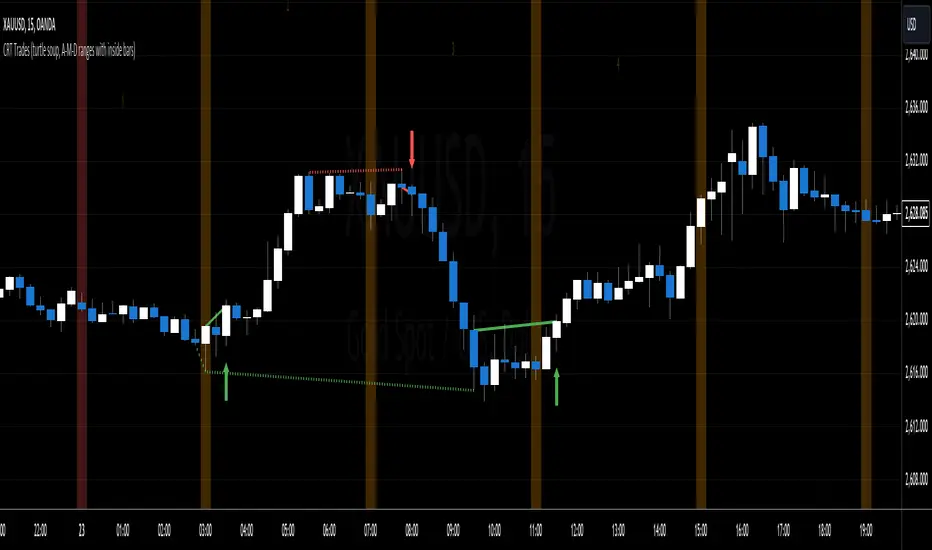
CRT means Candle Range Theory. Every single candle is a range, on every single timeframe. Ranges may be either manipulated - turtle souped or broken - engulfed - closed above/below and retested.
CRT is usually presented as a 3 candle model. However it may consist of more than 3 candles due to inside bars. Inside bar is the candle where high is not higher then previous candle high and low is not lower then previous candle low.
First candle represents accumulation (may consist of more candles - inside bars), second candle represents manipulation (turtle soup) and third candle represents distribution. The abbreviation for that is A-M-D.
In accumulation the range with specific high and low is created. In manipulation (turtle soup) the high or low of the range is manipulated - liquidity taken and price should usually reverse back to the range. In distribution price is reversing back to the opposite side of the range. On higher timeframe it looks like manipulation candle wick is higher/lower than previous range high/low (may consist of 1 or more inside bar candles) but the body must not close above/below previous range high/low. Otherwise it is not manipulation (turtle soup) most likely and price should continue in direction of the candle close. Distribution candle should touch opposite side of range and it is mostly heavy and fast candle.
CRT model can be found on higher timeframe (e.g. 4h) and entries can be found on lower timeframe (e.g. 15m). You always use only lower timeframe on your chart because CRT model on the higher timeframe is shown on the lower one and also you can plan entries on the lower timeframe. You are able to change CRT model higher timeframe in the indicator settings.
There are two types of entries:
Stop loss can be placed above/below of the top/bottom created by manipulation candle. First take profit should be placed in 1/2 of the accumulation range and second take profit should be placed at the opposite range of accumulation range.
It is possible to filter only particular accumulation (range) and manipulation (turtle soup) candles depending also on timezone set in the settings. For example on 4h CRT model if you fill input "indices" for section "range" like 1,2 and input "indices" for section "turtle soup" like 3,4 then you are awaiting the range to form during asia session and manipulation during london session if the timezone is somewhere around "UTC+2".
Dotted lines represent turtle soup of previous range and solid lines represent engulfing candle of the breaker candle on lower timeframe. When the engulfing is closed you can look for entries either by market order after closing or by limit order when the price retraces to order block (created by breaker candle) or fair value gap (created by engulfing).
Recommendations for combining lower (entries) and higher (crt model) timeframes:
CRT is usually presented as a 3 candle model. However it may consist of more than 3 candles due to inside bars. Inside bar is the candle where high is not higher then previous candle high and low is not lower then previous candle low.
First candle represents accumulation (may consist of more candles - inside bars), second candle represents manipulation (turtle soup) and third candle represents distribution. The abbreviation for that is A-M-D.
In accumulation the range with specific high and low is created. In manipulation (turtle soup) the high or low of the range is manipulated - liquidity taken and price should usually reverse back to the range. In distribution price is reversing back to the opposite side of the range. On higher timeframe it looks like manipulation candle wick is higher/lower than previous range high/low (may consist of 1 or more inside bar candles) but the body must not close above/below previous range high/low. Otherwise it is not manipulation (turtle soup) most likely and price should continue in direction of the candle close. Distribution candle should touch opposite side of range and it is mostly heavy and fast candle.
CRT model can be found on higher timeframe (e.g. 4h) and entries can be found on lower timeframe (e.g. 15m). You always use only lower timeframe on your chart because CRT model on the higher timeframe is shown on the lower one and also you can plan entries on the lower timeframe. You are able to change CRT model higher timeframe in the indicator settings.
There are two types of entries:
- simple - wait for manipulation candle to close on higher timeframe (HTF) and then enter on lower timeframe (LTF) above open of the distribution candle on HTF if it is short or on LTF below open of the distribution candle on HTF if it is long. These entries can be done by market order.
- advanced - wait for the break of previous range high/low and enter by limit order when price reverses back to the range and retraces to the order block or fair value gap created by the breaker candle.
Stop loss can be placed above/below of the top/bottom created by manipulation candle. First take profit should be placed in 1/2 of the accumulation range and second take profit should be placed at the opposite range of accumulation range.
It is possible to filter only particular accumulation (range) and manipulation (turtle soup) candles depending also on timezone set in the settings. For example on 4h CRT model if you fill input "indices" for section "range" like 1,2 and input "indices" for section "turtle soup" like 3,4 then you are awaiting the range to form during asia session and manipulation during london session if the timezone is somewhere around "UTC+2".
Dotted lines represent turtle soup of previous range and solid lines represent engulfing candle of the breaker candle on lower timeframe. When the engulfing is closed you can look for entries either by market order after closing or by limit order when the price retraces to order block (created by breaker candle) or fair value gap (created by engulfing).
Recommendations for combining lower (entries) and higher (crt model) timeframes:
- 1D CRT model => 1h entries,
- 4h CRT model => 15m entries,
- 1h CRT model => 5m entries,
- 15m CRT model => 1m entries.
릴리즈 노트
Showing of SL & TP, Order Block and Fair Value Gaps have been added.보호된 스크립트입니다
이 스크립트는 비공개 소스로 게시됩니다. 하지만 이를 자유롭게 제한 없이 사용할 수 있습니다 – 자세한 내용은 여기에서 확인하세요.
면책사항
해당 정보와 게시물은 금융, 투자, 트레이딩 또는 기타 유형의 조언이나 권장 사항으로 간주되지 않으며, 트레이딩뷰에서 제공하거나 보증하는 것이 아닙니다. 자세한 내용은 이용 약관을 참조하세요.
면책사항
해당 정보와 게시물은 금융, 투자, 트레이딩 또는 기타 유형의 조언이나 권장 사항으로 간주되지 않으며, 트레이딩뷰에서 제공하거나 보증하는 것이 아닙니다. 자세한 내용은 이용 약관을 참조하세요.