OPEN-SOURCE SCRIPT
업데이트됨 X mirror
X σ Mirror — Volatility Projection & Price Action Guide
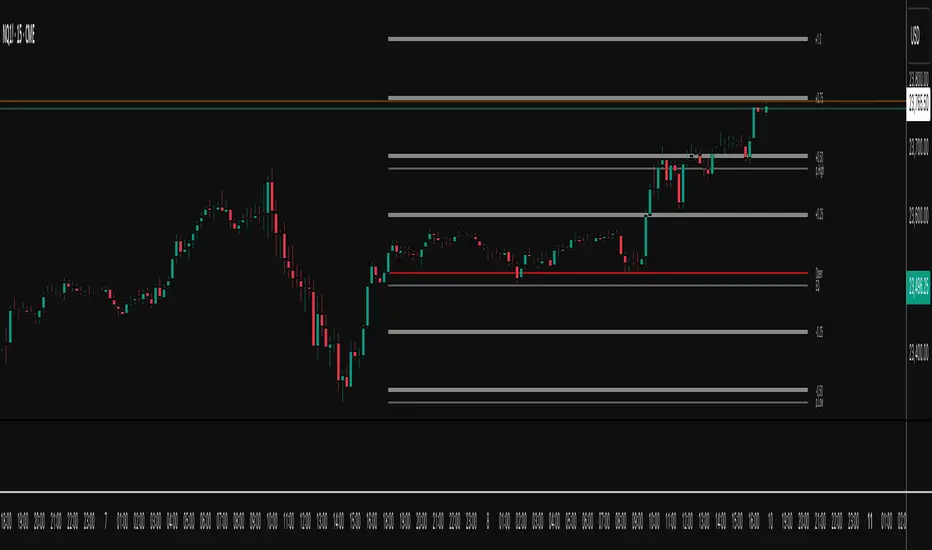
The X σ Mirror is a volatility-mapping tool that measures the prior period’s trading range, then mirrors and projects that range onto the current period. Anchored from the current period’s opening price, the indicator divides this projected range into quartiles, creating a structured price map that adapts to the asset’s recent volatility profile.
Core Methodology
Range Measurement – At the close of each user-selected higher timeframe (daily, 4-hour, weekly, etc.), the indicator captures the prior period’s high, low, and midpoint (equilibrium). This defines the “volatility envelope” for the next period.
Projection from the Open – The full prior range is projected above and below the current period’s open. This symmetrical mirroring anchors the volatility measurement to a logical starting point for intraperiod price movement.
Quartile Breakdown – The projected range is segmented into precise increments: 0.25×, 0.50×, 0.75×, 1.0×, 1.25×, 1.5×, and 2.0× of the prior range. These serve as price “checkpoints” that reflect proportional expansions or contractions relative to historical volatility.
How It Guides Price Action
Dynamic Support & Resistance – Quartile levels often act as temporary barriers or accelerators for price movement, highlighting areas where order flow may cluster.
Momentum Tracking – Price acceptance above successive quartiles suggests sustained directional strength, while repeated failures to breach a quartile indicate exhaustion.
Risk Management – The mirrored range and quartile levels help traders size positions, define stop placements, and set profit targets with volatility-adjusted precision.
Market Context – By anchoring the projection from the open, the indicator aligns volatility expectations with the session’s actual market structure, rather than static fixed levels.
Application
The X σ Mirror is adaptable across assets and timeframes, making it suitable for intraday traders tracking the unfolding session, as well as swing traders monitoring multi-day expansion potential. By combining historical range analysis with real-time market positioning, it provides a balanced framework for anticipating price behavior within a probabilistic structure.
릴리즈 노트
code clean up릴리즈 노트
minor code clean up 오픈 소스 스크립트
트레이딩뷰의 진정한 정신에 따라, 이 스크립트의 작성자는 이를 오픈소스로 공개하여 트레이더들이 기능을 검토하고 검증할 수 있도록 했습니다. 작성자에게 찬사를 보냅니다! 이 코드는 무료로 사용할 수 있지만, 코드를 재게시하는 경우 하우스 룰이 적용된다는 점을 기억하세요.
면책사항
해당 정보와 게시물은 금융, 투자, 트레이딩 또는 기타 유형의 조언이나 권장 사항으로 간주되지 않으며, 트레이딩뷰에서 제공하거나 보증하는 것이 아닙니다. 자세한 내용은 이용 약관을 참조하세요.
오픈 소스 스크립트
트레이딩뷰의 진정한 정신에 따라, 이 스크립트의 작성자는 이를 오픈소스로 공개하여 트레이더들이 기능을 검토하고 검증할 수 있도록 했습니다. 작성자에게 찬사를 보냅니다! 이 코드는 무료로 사용할 수 있지만, 코드를 재게시하는 경우 하우스 룰이 적용된다는 점을 기억하세요.
면책사항
해당 정보와 게시물은 금융, 투자, 트레이딩 또는 기타 유형의 조언이나 권장 사항으로 간주되지 않으며, 트레이딩뷰에서 제공하거나 보증하는 것이 아닙니다. 자세한 내용은 이용 약관을 참조하세요.