PROTECTED SOURCE SCRIPT
EMA50 Z-Score Indicator
EMA50 Z-Score Indicator
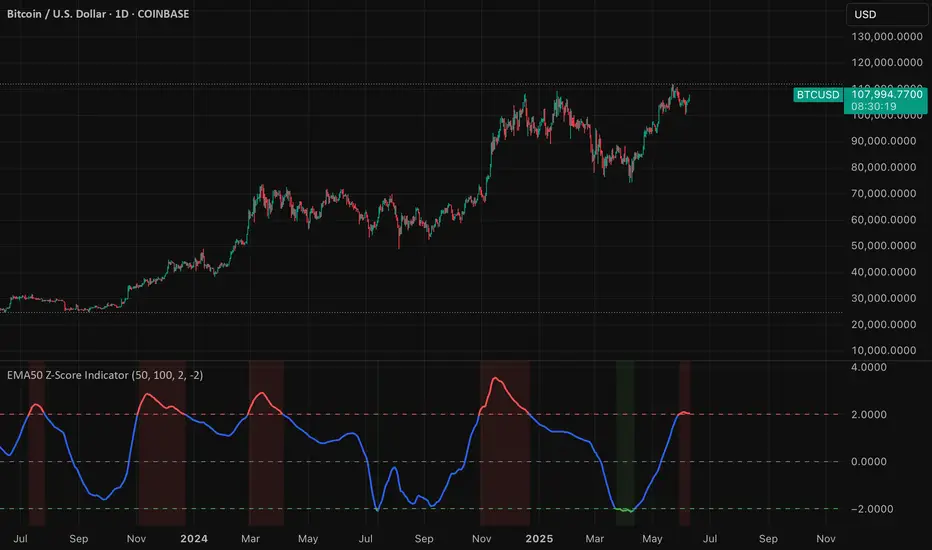
The EMA50 Z-Score Indicator is a quantitative tool that standardizes the behavior of the 50-period Exponential Moving Average (EMA) using statistical normalization. It measures how far the current EMA50 deviates from its recent historical average in terms of standard deviations, offering a probabilistic lens into trend extension and potential reversion zones.
Purpose
Traditional moving averages provide directional trend data but lack statistical context. This indicator addresses that by applying a Z-Score transformation to the EMA50, which allows traders to assess whether the trend is overextended—either to the upside or downside—relative to its own recent history.
Methodology
The indicator calculates the Z-Score using the following formula:
Z = (EMA50 - SMA of EMA50) / Standard Deviation of EMA50
The Z-Score is computed over a user-defined lookback period (default: 100 periods), allowing it to adapt to various market conditions while preserving statistical validity.
Interpretation
Overbought Conditions: When the Z-Score exceeds a predefined positive threshold (e.g., +1.25 or +2.0), the EMA50 is statistically extended to the upside. This may indicate elevated trend momentum or exhaustion, depending on context.
Oversold Conditions: When the Z-Score falls below a predefined negative threshold (e.g., −1.25 or −2.0), the EMA50 is compressed relative to its norm, potentially signaling undervaluation or capitulation.
Neutral Conditions: A Z-Score near zero indicates that the EMA50 is near its historical average, suggesting the trend is behaving within expected bounds.
보호된 스크립트입니다
이 스크립트는 비공개 소스로 게시됩니다. 하지만 이를 자유롭게 제한 없이 사용할 수 있습니다 – 자세한 내용은 여기에서 확인하세요.
면책사항
해당 정보와 게시물은 금융, 투자, 트레이딩 또는 기타 유형의 조언이나 권장 사항으로 간주되지 않으며, 트레이딩뷰에서 제공하거나 보증하는 것이 아닙니다. 자세한 내용은 이용 약관을 참조하세요.
면책사항
해당 정보와 게시물은 금융, 투자, 트레이딩 또는 기타 유형의 조언이나 권장 사항으로 간주되지 않으며, 트레이딩뷰에서 제공하거나 보증하는 것이 아닙니다. 자세한 내용은 이용 약관을 참조하세요.