INVITE-ONLY SCRIPT
업데이트됨 Supply & Demand Trade Analyzer by NYTC
Supply and Demand Trade Analyzer
Automatic Zone Identification
• Identifies high quality supply and demand zones on multiple timeframes
• Shows the prices for each zone so the user may easily identify actionable prices to buy or sell
• Once a zone is no longer valid, it is automatically removed from the chart to keep the workspace clean.
• Includes all 4 zone formations: DBR, RBR, RBD and DBD
What are supply and demand zones?
Supply and demand zones are visual representations of areas where there has been a price imbalance. Whenever a demand imbalance is detected, the indicator will plot a green demand zone which may be used as an area to buy under the right market conditions, such as an uptrend or to take profit on a short position. Also, whenever a supply imbalance is detected, the indicator will plot a red supply zone which may be used as an area to sell under the right conditions such as a downtrend or to take profit on a long position.
Automatic Trend Analysis
Proper trend analysis is one of the most important steps in successfully trading or investing in the financial markets as it helps the trader determine which side of the market, he/she wants to take: long or short. For this reason, we decided to also include in this indicator our unique trend analysis technique that utilizes highs and lows to detect when trends begin, how they continue and when they end. The indicator is able properly identify uptrends (Higher Highs and Higher Lows), downtrend (Lower Highs and Lower Lows), and sideways trends (relatively equal highs and lows, higher highs but lower lows or lower highs but higher lows).
• The trader can toggle this feature on or off as needed.
• Our unique trend indicator is located at the bottom of the chart so, as not to interfere with the candles and hide important information.
• When the indicator shows green, the trend is up, when it shows red, the trend is down and sideways when the indicator shows grey.
How it works
Being that supply and demand zones are areas of potential imbalance, under the right conditions price may reverse at these zones. Use them in conjunction with your entry and exit rules to maximize efficacy and minimize risk.
User Inputs
In the settings menu you will find the following functions:
• Zone Count: Allows the trader to determine how many zones are shown on the chart
• Zone-on-Zone: Give the trader the option to also see overlapping zones
• Minor Zones: While the indicator plots major zones by default, this function gives the trader to see all zones in real time as they are being formed.
• HTF Trend: Give the trader the option to turn on our unique trend identification tool
• LTF Momentum: Allows the trader to toggle on or off our unique lower timeframe momentum finder. This tool is best used during the Globex of the Futures session for short-term trading (scalping)
Instruments
Our Trade Analyzer works across all asset classes and on all instruments, including:
Stocks
Futures
Forex
Cryptocurrencies
Summary
The Supply and Demand Trade Analyzer offers traders a quick and easy way of identifying supply and demand or support and resistance areas on a chart. It provides:
• Zone Identification: Proper zone identification on multiple timeframes
• User-Friendly Customization: With a variety of user inputs, you can tailor the analyzer to fit your unique trading strategy.
• Cross-Asset Compatibility: Works seamlessly across all major asset classes and instruments.
• Clean Workspace: Automatic removal of invalid zones keeps your chart organized and focused on the most relevant information.
• Real-Time Insights: Stay ahead of the market with real-time zone plotting and trend analysis, enabling timely and strategic trades.
릴리즈 노트
Trend and momentum update릴리즈 노트
Zoning update릴리즈 노트
Trend update릴리즈 노트
Zones update릴리즈 노트
Momentum Stage update릴리즈 노트
Zones update릴리즈 노트
Trend update릴리즈 노트
Zones update릴리즈 노트
Zones, Trend, Momentum Stages updates릴리즈 노트
Zones update릴리즈 노트
Zones update릴리즈 노트
Zones and Trend Update릴리즈 노트
Zones and Trend UpdateThis important update gives the user options to:
1. Choose zone color preferences
2. Choose which timeframe trend to display on the current chart
3. Change trend indicator colors
4. A color has also been added to the trend indicator for sideways trends
릴리즈 노트
Reversal patters and Tool Tips added릴리즈 노트
In this update we added:- Multiple TF Trend Analysis
- Bullish/Bearish signal in the top right corner of the chart based on multiple trend combinations
릴리즈 노트
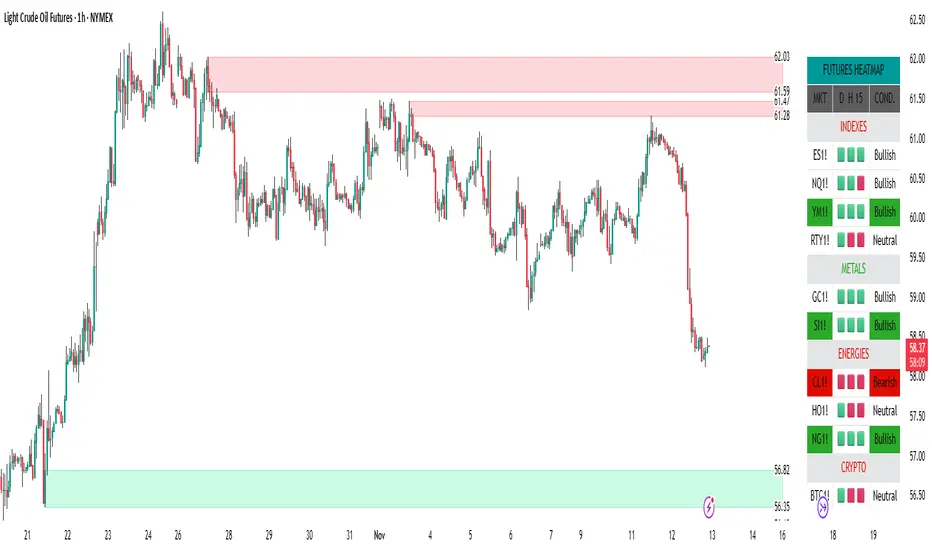
This update includes our new Futures heatmap that tells which markets are stronger or weaker. This will help traders make better decisions and simply the process by filtering out markets that do not meet their criteria.릴리즈 노트
Heatmap update릴리즈 노트
Heatmap was updated to include ATRThe heatmap can be turn on/off. The ATR section can also be turned on/off leaving just the heatmap visible.
릴리즈 노트
Heatmap update릴리즈 노트
Heatmap update릴리즈 노트
Heatmap update릴리즈 노트
Heatmap update릴리즈 노트
Heatmap update릴리즈 노트
Heatmap update릴리즈 노트
Heatmap update릴리즈 노트
Updated Heatmap and Trends릴리즈 노트
Trend update릴리즈 노트
Updated Heatmap릴리즈 노트
Heatmap update: Optimized and Now available as of 8:30am EST릴리즈 노트
Heatmap toggle updated릴리즈 노트
Heatmap toggled update릴리즈 노트
...릴리즈 노트
Updated to V6릴리즈 노트
Heatmap update릴리즈 노트
Reversal Patterns Update릴리즈 노트
Heatmap update릴리즈 노트
Updates:Trend Zones
Heatmap
릴리즈 노트
The newly updated heatmap, designed to give traders a comprehensive, real-time view of market strength across all major futures sectors — including Indexes, Metals, Energies, Natural Gas, and Bitcoin. This update delivers improved performance, enhanced visual clarity, and dynamic trend tracking across multiple timeframes. The heatmap now features refined color-coded momentum signals and a cleaner layout, making it easier than ever to identify the strongest and weakest markets at a glance. Whether you’re a short-term scalper or long-term swing trader, this tool provides the edge you need to make confident, data-driven trading decisions — all within one powerful, customizable dashboard.릴리즈 노트
Zones update릴리즈 노트
Zone update초대 전용 스크립트
이 스크립트는 작성자가 승인한 사용자만 접근할 수 있습니다. 사용하려면 요청 후 승인을 받아야 하며, 일반적으로 결제 후에 허가가 부여됩니다. 자세한 내용은 아래 작성자의 안내를 따르거나 NewYorkTradersClub에게 직접 문의하세요.
트레이딩뷰는 스크립트의 작동 방식을 충분히 이해하고 작성자를 완전히 신뢰하지 않는 이상, 해당 스크립트에 비용을 지불하거나 사용하는 것을 권장하지 않습니다. 커뮤니티 스크립트에서 무료 오픈소스 대안을 찾아보실 수도 있습니다.
작성자 지시 사항
You may request access to our indicator through our website. If you have questions, you may also reach us via email at admin@newyorktradingclub.com or through the Tradingview chat.
NYTC
면책사항
해당 정보와 게시물은 금융, 투자, 트레이딩 또는 기타 유형의 조언이나 권장 사항으로 간주되지 않으며, 트레이딩뷰에서 제공하거나 보증하는 것이 아닙니다. 자세한 내용은 이용 약관을 참조하세요.
초대 전용 스크립트
이 스크립트는 작성자가 승인한 사용자만 접근할 수 있습니다. 사용하려면 요청 후 승인을 받아야 하며, 일반적으로 결제 후에 허가가 부여됩니다. 자세한 내용은 아래 작성자의 안내를 따르거나 NewYorkTradersClub에게 직접 문의하세요.
트레이딩뷰는 스크립트의 작동 방식을 충분히 이해하고 작성자를 완전히 신뢰하지 않는 이상, 해당 스크립트에 비용을 지불하거나 사용하는 것을 권장하지 않습니다. 커뮤니티 스크립트에서 무료 오픈소스 대안을 찾아보실 수도 있습니다.
작성자 지시 사항
You may request access to our indicator through our website. If you have questions, you may also reach us via email at admin@newyorktradingclub.com or through the Tradingview chat.
면책사항
해당 정보와 게시물은 금융, 투자, 트레이딩 또는 기타 유형의 조언이나 권장 사항으로 간주되지 않으며, 트레이딩뷰에서 제공하거나 보증하는 것이 아닙니다. 자세한 내용은 이용 약관을 참조하세요.