OPEN-SOURCE SCRIPT
Spread Rebalance Simulation
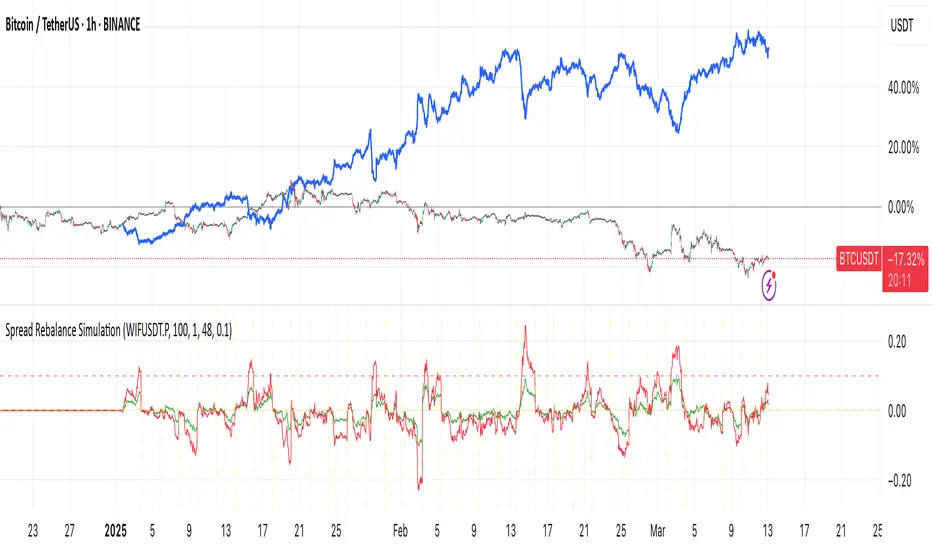
The Spread Rebalance Simulator is a tool designed to help visualize the effect of rebalancing on spread trading returns. Typically, TradingView charts are used to display spread charts, but this method assumes that the ratio remains unchanged on each bar. In real trading scenarios, the ratio constantly changes, and this indicator allows traders to see a more accurate representation of spread trading.
The next version will include support for input ratio and trading cost.
To use this simply select any chart (as a long pair) then fill the symbol name for the short pair. Then choose the rebalance period. The blue line will show you the equity of this pair combination.
The next version will include support for input ratio and trading cost.
To use this simply select any chart (as a long pair) then fill the symbol name for the short pair. Then choose the rebalance period. The blue line will show you the equity of this pair combination.
오픈 소스 스크립트
트레이딩뷰의 진정한 정신에 따라, 이 스크립트의 작성자는 이를 오픈소스로 공개하여 트레이더들이 기능을 검토하고 검증할 수 있도록 했습니다. 작성자에게 찬사를 보냅니다! 이 코드는 무료로 사용할 수 있지만, 코드를 재게시하는 경우 하우스 룰이 적용된다는 점을 기억하세요.
면책사항
해당 정보와 게시물은 금융, 투자, 트레이딩 또는 기타 유형의 조언이나 권장 사항으로 간주되지 않으며, 트레이딩뷰에서 제공하거나 보증하는 것이 아닙니다. 자세한 내용은 이용 약관을 참조하세요.
오픈 소스 스크립트
트레이딩뷰의 진정한 정신에 따라, 이 스크립트의 작성자는 이를 오픈소스로 공개하여 트레이더들이 기능을 검토하고 검증할 수 있도록 했습니다. 작성자에게 찬사를 보냅니다! 이 코드는 무료로 사용할 수 있지만, 코드를 재게시하는 경우 하우스 룰이 적용된다는 점을 기억하세요.
면책사항
해당 정보와 게시물은 금융, 투자, 트레이딩 또는 기타 유형의 조언이나 권장 사항으로 간주되지 않으며, 트레이딩뷰에서 제공하거나 보증하는 것이 아닙니다. 자세한 내용은 이용 약관을 참조하세요.