PROTECTED SOURCE SCRIPT
[DEM] Donchian Oscillator
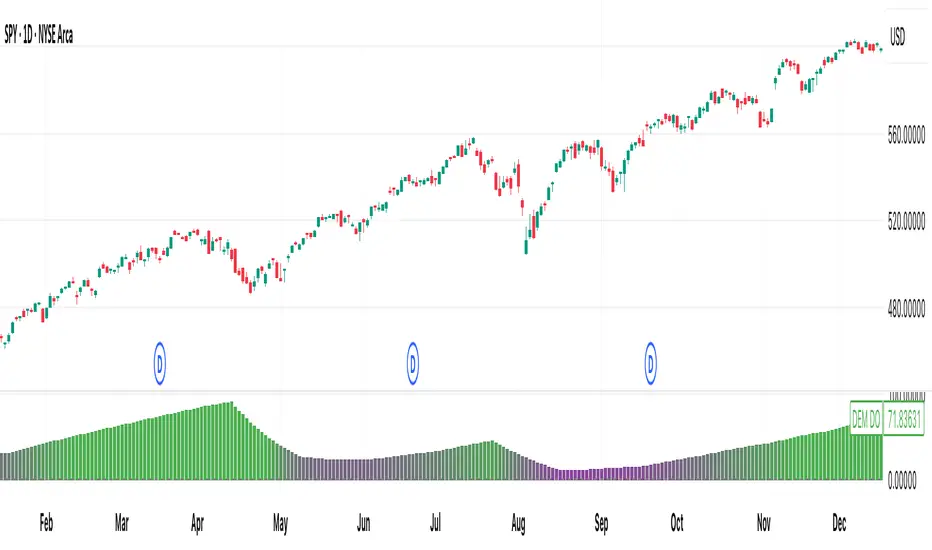
[DEM] Donchian Oscillator is designed to measure the relative position of recent price action within the Donchian Channel by calculating how many bars have passed since the most recent highest high versus the most recent lowest low over a specified lookback period. The indicator computes the difference between bars since the last low and bars since the last high, then applies smoothing using an RMA to create an oscillator that fluctuates around a zero centerline displayed in a separate pane below the main chart. The oscillator uses gradient coloring from red (negative values indicating recent lows dominate) through purple (neutral) to green (positive values indicating recent highs dominate), helping traders identify momentum shifts and potential overbought/oversold conditions based on whether price is closer to making new highs or new lows within the specified range.
보호된 스크립트입니다
이 스크립트는 비공개 소스로 게시됩니다. 하지만 이를 자유롭게 제한 없이 사용할 수 있습니다 – 자세한 내용은 여기에서 확인하세요.
면책사항
해당 정보와 게시물은 금융, 투자, 트레이딩 또는 기타 유형의 조언이나 권장 사항으로 간주되지 않으며, 트레이딩뷰에서 제공하거나 보증하는 것이 아닙니다. 자세한 내용은 이용 약관을 참조하세요.
보호된 스크립트입니다
이 스크립트는 비공개 소스로 게시됩니다. 하지만 이를 자유롭게 제한 없이 사용할 수 있습니다 – 자세한 내용은 여기에서 확인하세요.
면책사항
해당 정보와 게시물은 금융, 투자, 트레이딩 또는 기타 유형의 조언이나 권장 사항으로 간주되지 않으며, 트레이딩뷰에서 제공하거나 보증하는 것이 아닙니다. 자세한 내용은 이용 약관을 참조하세요.