OPEN-SOURCE SCRIPT
업데이트됨 Power X Strategy Back-test
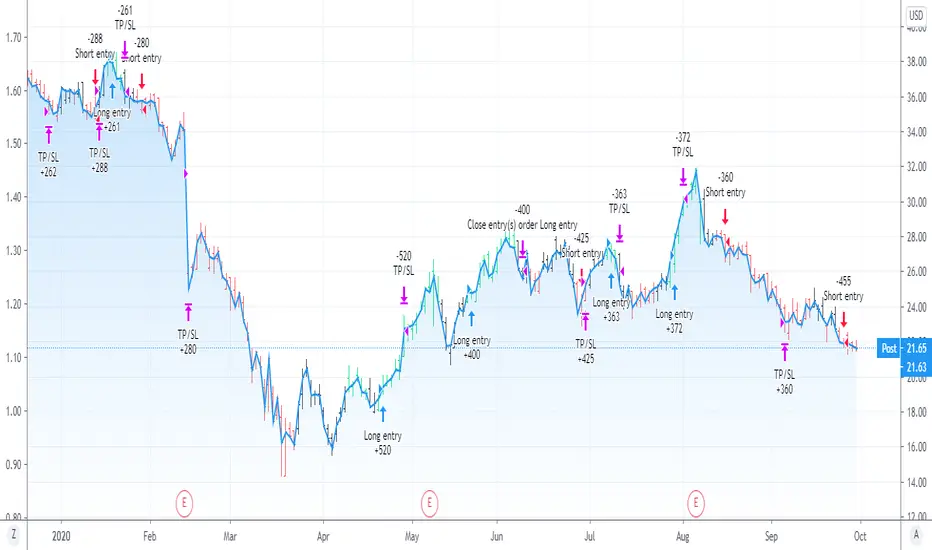
This script back-test the Power X Strategy developed by Markus Heitkoetter and Rockwell Trading. For more detail about the strategy, please refer to "The PowerX Strategy: How to Trade Stocks and Options in Only 15 Minutes a Day" written by Markus Heitkoetter. Note that this script is not publish, develop or maintain by Rockwell Trading, and may have different results. Rockwell Trading has a powerful software called Power X Optimizer, which scan, back-test and optimize the best stock for the strategy.
The Power X Strategy uses RSI , Slow Stochastic and MACD indicators under the hood. When RSI and slow Stochastic are both greater than 50 and MACD crosses up the signal line, it marks as up-trend. If RSI and slow stochastic are both less than 50 and MACD crosses down the signal line, it marks as down-trend. Other are mark as no trend.
This back-test makes a long entry with an up-trend momentum and short entry with down-trend momentum. Trade is exited when profit target or stop lose is reach. Profit target and stop lose is calculated based on 7 days Average Daily Range (ADR).
If the either of the momentum is lost, trade is exited the next day. It also skips the entire month of March 2020, since the market crash and is not in a normal market condition for the strategy.
릴리즈 노트
This script back-test the Power X Strategy developed by Markus Heitkoetter and Rockwell Trading. For more detail about the strategy, please refer to "The PowerX Strategy: How to Trade Stocks and Options in Only 15 Minutes a Day" written by Markus Heitkoetter. Note that this script is not publish, develop or maintain by Rockwell Trading, and may have different results. Rockwell Trading has a powerful software called Power X Optimizer, which scan, back-test and optimize the best stock for the strategy.The Power X Strategy uses RSI , Slow Stochastic and MACD indicators under the hood. When RSI and slow Stochastic are both greater than 50 and MACD crosses up the signal line, it marks as up-trend. If RSI and slow stochastic are both less than 50 and MACD crosses down the signal line, it marks as down-trend. Other are mark as no trend.
This back-test makes a long entry with an up-trend momentum and short entry with down-trend momentum. Trade is exited when profit target or stop lose is reach. Profit target and stop lose is calculated based on 7 days Average Daily Range (ADR).
If the either of the momentum is lost, trade is exited the next day. It also skips the entire month of March 2020, since the market crash and is not in a normal market condition for the strategy.
V2
- Removed the option for only testing long or short. Since it was not working at the first place
- Added an input check box as an option skip the month of March due to the Covid-19 crash. Default is to skip it.
- Added an input option to adjust the amount of the account to risk. The default is 100%.
릴리즈 노트
- Udpate the covid-19 crash period. Skipping Feb 20 2020 to Mar 26 2020.릴리즈 노트
- Add option to not enter a trade if the stock gapped more than certain %. Enable by a checkbox.- The default of maximum gap is 2%
릴리즈 노트
- Adjust average daily range to be the average range of past 7 interval period which allows for testing the strategy on different interval.릴리즈 노트
- update default start date오픈 소스 스크립트
트레이딩뷰의 진정한 정신에 따라, 이 스크립트의 작성자는 이를 오픈소스로 공개하여 트레이더들이 기능을 검토하고 검증할 수 있도록 했습니다. 작성자에게 찬사를 보냅니다! 이 코드는 무료로 사용할 수 있지만, 코드를 재게시하는 경우 하우스 룰이 적용된다는 점을 기억하세요.
면책사항
해당 정보와 게시물은 금융, 투자, 트레이딩 또는 기타 유형의 조언이나 권장 사항으로 간주되지 않으며, 트레이딩뷰에서 제공하거나 보증하는 것이 아닙니다. 자세한 내용은 이용 약관을 참조하세요.
오픈 소스 스크립트
트레이딩뷰의 진정한 정신에 따라, 이 스크립트의 작성자는 이를 오픈소스로 공개하여 트레이더들이 기능을 검토하고 검증할 수 있도록 했습니다. 작성자에게 찬사를 보냅니다! 이 코드는 무료로 사용할 수 있지만, 코드를 재게시하는 경우 하우스 룰이 적용된다는 점을 기억하세요.
면책사항
해당 정보와 게시물은 금융, 투자, 트레이딩 또는 기타 유형의 조언이나 권장 사항으로 간주되지 않으며, 트레이딩뷰에서 제공하거나 보증하는 것이 아닙니다. 자세한 내용은 이용 약관을 참조하세요.