PROTECTED SOURCE SCRIPT
[Pandora's Chambers] Liquidity Zones F[attr_rep] V1
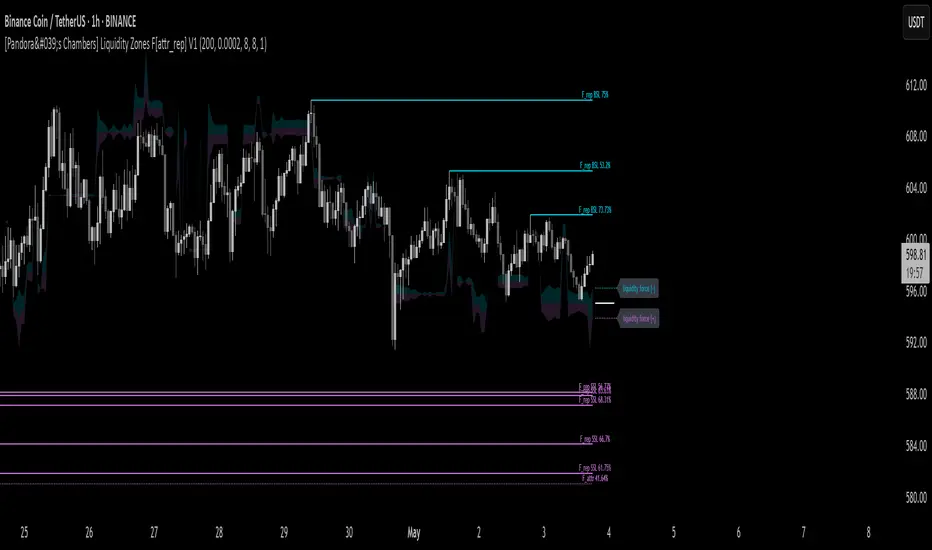
The [Pandora’s Chambers] Liquidity Zones F[attr_rep] V1 indicator merges visual liquidity‐zone analysis with a mathematical model that quantifies opposing market forces. It scans a historical lookback window to compute average volume (avgVol), aggregates cumulative buy/sell volumes, detects significant wicks, and renders main and dotted lines plus background fills to show pressure at each price level. After constructing these graphic elements, it scores each signal (up to 130 points) and converts it into a percentage (0–100%) mapped onto a five‑domain polar scale:
0–50: Negative dominance
50–60: Initial equilibrium
60–75: Positive momentum build‑up
75–80: Decay of positive effect
80–100: Positive overextension with reversal potential
1. How It Works
Lookback & avgVol:
– Computes a simple moving average of volume over lookback bars.
cumBuy / cumSell:
– Adds volume to cumBuy when bar close > open; to cumSell when close < open.
Wick Detection:
– Flags bars whose wick length exceeds body length; records creation price, wickFactor, and volume.
Line Creation:
– For each strong wick, draws a solid “main” line and a dotted “secondary” line, with placeholder labels.
Scoring & Chance%:
– On each new bar, computes volume delta since creation, applies weighted scoring (wickFactor, volume ratio, proximity, leverage, imbalance) up to 130 points.
– Converts score to chancePerc (0–100%).
Style & Label Updates:
– ≥76%: dashed line; 50–76%: solid or dotted by classification; <50%: dotted “F_attr.”
– Labels show “F_rep …” or “F_attr X%.”
Magnet Lines:
– Identifies lowest bullish‐main price and highest bearish‐main price, computes midPrice and relative fraction, then calculates targetPrice A/B.
– Draws dotted magnet lines and labels “liquidity force (+)/(–)” beside price chart.
Background Fill:
– Fills area between midPrice and bullishTarget in bullish color; between midPrice and bearishTarget in bearish color.
2. Settings & Inputs
Parameter Default Description
lookback 200 Number of bars to calculate average and cumulative volumes.
offsetDot 0.0002 Vertical spacing between dotted lines.
ratioLineLength 8 Length (in bars) of the magnet line.
ratioLineOffset 8 Horizontal offset (bars) for magnet placement.
ratioLineWidth 1 Width of magnet lines (1–10).
bullish_line_color #00BCD4 Color for bullish main and dotted lines.
bearish_line_color #BA68C8 Color for bearish main and dotted lines.
Advanced Tweaks:
Adjust the number of dotted “grade” lines per wick or modify the scoring thresholds for custom classification.
3. Interpretation & Polar Scale
The x value (chancePerc) is interpreted across five polar domains for concise force balance reading:
0 ≤ x < 50: Selling dominance – consider exit or avoidance.
50 ≤ x < 60: Early balance – await confirmation.
60 ≤ x < 75: Rising buy pressure.
75 ≤ x < 80: Slowing bullish momentum.
80 ≤ x ≤ 100: Overextended bullish – watch for potential reversal.
보호된 스크립트입니다
이 스크립트는 비공개 소스로 게시됩니다. 하지만 이를 자유롭게 제한 없이 사용할 수 있습니다 – 자세한 내용은 여기에서 확인하세요.
면책사항
해당 정보와 게시물은 금융, 투자, 트레이딩 또는 기타 유형의 조언이나 권장 사항으로 간주되지 않으며, 트레이딩뷰에서 제공하거나 보증하는 것이 아닙니다. 자세한 내용은 이용 약관을 참조하세요.
보호된 스크립트입니다
이 스크립트는 비공개 소스로 게시됩니다. 하지만 이를 자유롭게 제한 없이 사용할 수 있습니다 – 자세한 내용은 여기에서 확인하세요.
면책사항
해당 정보와 게시물은 금융, 투자, 트레이딩 또는 기타 유형의 조언이나 권장 사항으로 간주되지 않으며, 트레이딩뷰에서 제공하거나 보증하는 것이 아닙니다. 자세한 내용은 이용 약관을 참조하세요.