OPEN-SOURCE SCRIPT
Backtest Strategy Optimizer Adapter - Supertrend Example
Sample Code
This is a sample code for my Backtest Strategy Optimizer Adapter library.
You can find the library at: https://www.tradingview.com/script/tsHCuCEi-Backtest-Strategy-Optimizer-Adapter/
Backtest Strategy Optimizer Tester
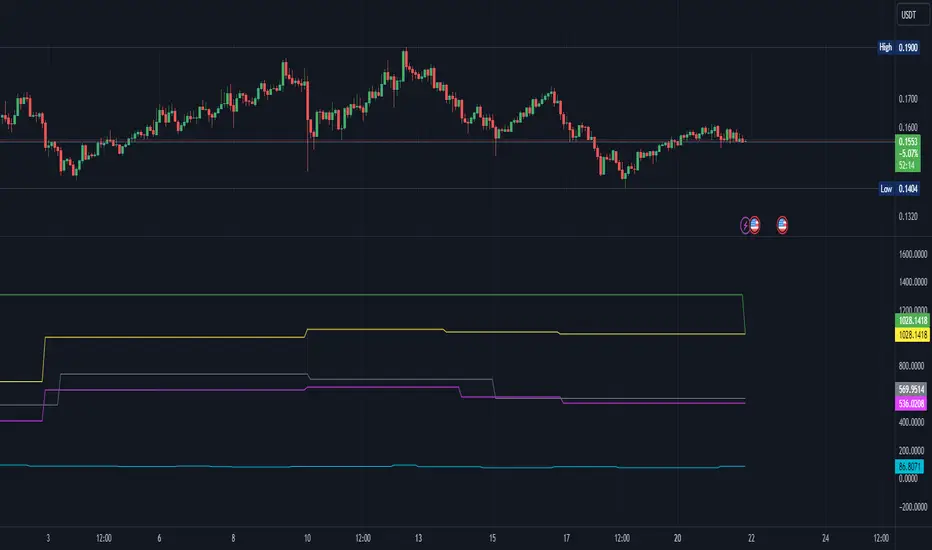
With this indicator, you will be able to run one or multiple backtests with different variables (combinations). For example, you can run dozens of backtests of Supertrend at once with an increment factor of 0.1, or whatever you prefer. This way, you can easily grab the most profitable settings and use them in your strategy. The chart above shows different color plots, each indicating a profit backtest equal to tradingview backtesting system. This code uses my backtest library, available in my profile.
Below the code you should edit yourself
You can use ChatGPT or write a python script to autogenerate code for you.
Pine Script®
This is a sample code for my Backtest Strategy Optimizer Adapter library.
You can find the library at: https://www.tradingview.com/script/tsHCuCEi-Backtest-Strategy-Optimizer-Adapter/
Backtest Strategy Optimizer Tester
With this indicator, you will be able to run one or multiple backtests with different variables (combinations). For example, you can run dozens of backtests of Supertrend at once with an increment factor of 0.1, or whatever you prefer. This way, you can easily grab the most profitable settings and use them in your strategy. The chart above shows different color plots, each indicating a profit backtest equal to tradingview backtesting system. This code uses my backtest library, available in my profile.
Below the code you should edit yourself
You can use ChatGPT or write a python script to autogenerate code for you.
// #################################################################
// # ENTRIES AND EXITS
// #################################################################
// You can use the link and code in the description to create
// your code for the desired number of entries / exits.
// #################################################################
// AUTO GENERATED CODE [BEGIN]
// ▼▼▼▼▼▼▼▼▼▼▼▼▼▼▼▼▼▼▼▼▼▼▼▼▼▼▼▼▼▼▼▼▼▼▼▼▼▼▼▼▼▼▼▼▼▼▼▼▼▼▼▼▼▼▼▼▼▼▼▼▼▼▼▼▼
[_, _, _, entry_001, exit_001] = ti.supertrend(10, 0.1)
[_, _, _, entry_002, exit_002] = ti.supertrend(10, 0.2)
[_, _, _, entry_003, exit_003] = ti.supertrend(10, 0.3)
[_, _, _, entry_004, exit_004] = ti.supertrend(10, 0.4)
// 005 etc...
pnl_001 = backtest.profit(date_start, date_end, entry_001, exit_001)
pnl_002 = backtest.profit(date_start, date_end, entry_002, exit_002)
pnl_003 = backtest.profit(date_start, date_end, entry_003, exit_003)
pnl_004 = backtest.profit(date_start, date_end, entry_004, exit_004)
plot(pnl_001, title='0.1', color=backtest.color(001))
plot(pnl_002, title='0.2', color=backtest.color(002))
plot(pnl_003, title='0.3', color=backtest.color(003))
plot(pnl_004, title='0.4', color=backtest.color(004))
// Make sure you set the correct array size.
// The amount of tests + 1 (e.g. 4 tests you set it to 5)
var results_list = array.new_string(5)
if (ta.change(pnl_001))
array.set(results_list, 0, str.tostring(pnl_001) + '|0.1')
if (ta.change(pnl_002))
array.set(results_list, 1, str.tostring(pnl_002) + '|0.2')
if (ta.change(pnl_003))
array.set(results_list, 2, str.tostring(pnl_003) + '|0.3')
if (ta.change(pnl_004))
array.set(results_list, 3, str.tostring(pnl_004) + '|0.4')
// ▲▲▲▲▲▲▲▲▲▲▲▲▲▲▲▲▲▲▲▲▲▲▲▲▲▲▲▲▲▲▲▲▲▲▲▲▲▲▲▲▲▲▲▲▲▲▲▲▲▲▲▲▲▲▲▲▲▲▲▲▲▲▲▲▲
// AUTO GENERATED CODE [END]
// #################################################################
오픈 소스 스크립트
트레이딩뷰의 진정한 정신에 따라, 이 스크립트의 작성자는 이를 오픈소스로 공개하여 트레이더들이 기능을 검토하고 검증할 수 있도록 했습니다. 작성자에게 찬사를 보냅니다! 이 코드는 무료로 사용할 수 있지만, 코드를 재게시하는 경우 하우스 룰이 적용된다는 점을 기억하세요.
면책사항
해당 정보와 게시물은 금융, 투자, 트레이딩 또는 기타 유형의 조언이나 권장 사항으로 간주되지 않으며, 트레이딩뷰에서 제공하거나 보증하는 것이 아닙니다. 자세한 내용은 이용 약관을 참조하세요.
오픈 소스 스크립트
트레이딩뷰의 진정한 정신에 따라, 이 스크립트의 작성자는 이를 오픈소스로 공개하여 트레이더들이 기능을 검토하고 검증할 수 있도록 했습니다. 작성자에게 찬사를 보냅니다! 이 코드는 무료로 사용할 수 있지만, 코드를 재게시하는 경우 하우스 룰이 적용된다는 점을 기억하세요.
면책사항
해당 정보와 게시물은 금융, 투자, 트레이딩 또는 기타 유형의 조언이나 권장 사항으로 간주되지 않으며, 트레이딩뷰에서 제공하거나 보증하는 것이 아닙니다. 자세한 내용은 이용 약관을 참조하세요.