OPEN-SOURCE SCRIPT
업데이트됨 Fibonacci Average Range [UkutaLabs]
█ OVERVIEW
The Fibonacci Average Range indicator provides unique insight into key price-action levels within the market that can serve as powerful support and resistance levels. The Fibonacci Average Range is automatically generated purely from price-action; simplifying the decision-making process because price-action focuses on the most critical factor, price.
Through the use of its Fibonacci retracement levels, traders will be able to more accurately predict future direction and price movement of any given commodity.
The Fibonacci Average Range indicator is a powerful trading tool that provides unique insight into the market that can provide value to a wide variety of trading styles.
The aim of this script is to simplify the trading experience of users by automatically identifying and displaying price levels that they should be aware of.
█ USAGE
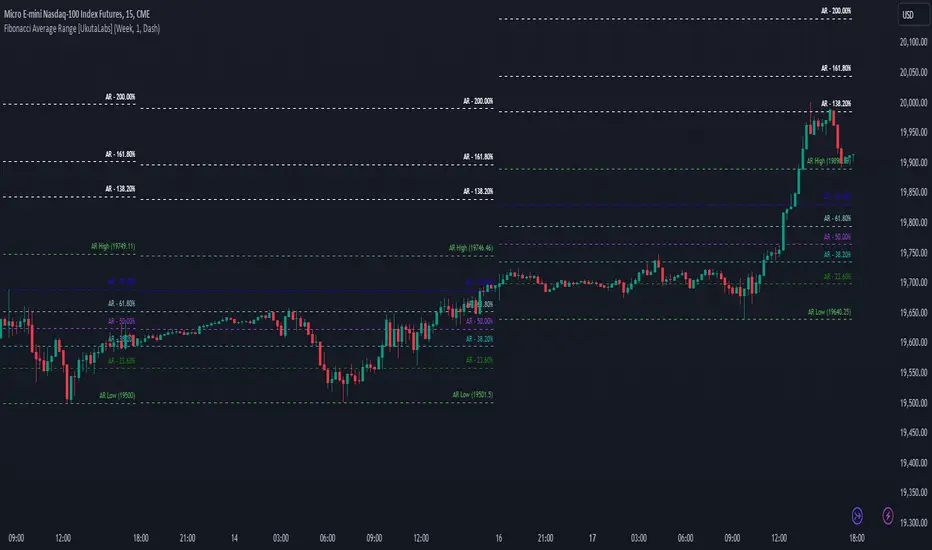
At the beginning of each trading day, the script will use relevant price-action information to calculate an expected range for the current trading day, giving traders unique insight into potential levels of support and resistance within the market.
Depending on current market conditions, the script will either generate from the current day’s high or the current day’s low, depending on whether the market shows bullish or bearish strength.
Within the total projected range, several other levels will be identified and labelled. These levels combine the script’s prediction for the day’s range and key Fibonacci Ratios to identify potentially powerful levels of support and resistance within.
Each line also has a label to identify what it represents, and these labels can be turned off in the settings.
█ SETTINGS
Configuration
• Show Labels: Determines whether labels get drawn.
• Current Day Open: Determines whether a line representing the current day’s open is drawn.
• Display Mode: Determines the number of days the script will load.
Line Settings
• Line Width: Determines the width of lines.
• Line Style: Determines the style of lines.
The Fibonacci Average Range indicator provides unique insight into key price-action levels within the market that can serve as powerful support and resistance levels. The Fibonacci Average Range is automatically generated purely from price-action; simplifying the decision-making process because price-action focuses on the most critical factor, price.
Through the use of its Fibonacci retracement levels, traders will be able to more accurately predict future direction and price movement of any given commodity.
The Fibonacci Average Range indicator is a powerful trading tool that provides unique insight into the market that can provide value to a wide variety of trading styles.
The aim of this script is to simplify the trading experience of users by automatically identifying and displaying price levels that they should be aware of.
█ USAGE
At the beginning of each trading day, the script will use relevant price-action information to calculate an expected range for the current trading day, giving traders unique insight into potential levels of support and resistance within the market.
Depending on current market conditions, the script will either generate from the current day’s high or the current day’s low, depending on whether the market shows bullish or bearish strength.
Within the total projected range, several other levels will be identified and labelled. These levels combine the script’s prediction for the day’s range and key Fibonacci Ratios to identify potentially powerful levels of support and resistance within.
Each line also has a label to identify what it represents, and these labels can be turned off in the settings.
█ SETTINGS
Configuration
• Show Labels: Determines whether labels get drawn.
• Current Day Open: Determines whether a line representing the current day’s open is drawn.
• Display Mode: Determines the number of days the script will load.
Line Settings
• Line Width: Determines the width of lines.
• Line Style: Determines the style of lines.
릴리즈 노트
.릴리즈 노트
-Added a new setting: Days To Load. This setting allows the user to configure the number of days that are used in calculation.-Fixed a bug that caused levels to not be drawn when the chart is not loading the specified number of days needed for calculations.
오픈 소스 스크립트
트레이딩뷰의 진정한 정신에 따라, 이 스크립트의 작성자는 이를 오픈소스로 공개하여 트레이더들이 기능을 검토하고 검증할 수 있도록 했습니다. 작성자에게 찬사를 보냅니다! 이 코드는 무료로 사용할 수 있지만, 코드를 재게시하는 경우 하우스 룰이 적용된다는 점을 기억하세요.
면책사항
해당 정보와 게시물은 금융, 투자, 트레이딩 또는 기타 유형의 조언이나 권장 사항으로 간주되지 않으며, 트레이딩뷰에서 제공하거나 보증하는 것이 아닙니다. 자세한 내용은 이용 약관을 참조하세요.
오픈 소스 스크립트
트레이딩뷰의 진정한 정신에 따라, 이 스크립트의 작성자는 이를 오픈소스로 공개하여 트레이더들이 기능을 검토하고 검증할 수 있도록 했습니다. 작성자에게 찬사를 보냅니다! 이 코드는 무료로 사용할 수 있지만, 코드를 재게시하는 경우 하우스 룰이 적용된다는 점을 기억하세요.
면책사항
해당 정보와 게시물은 금융, 투자, 트레이딩 또는 기타 유형의 조언이나 권장 사항으로 간주되지 않으며, 트레이딩뷰에서 제공하거나 보증하는 것이 아닙니다. 자세한 내용은 이용 약관을 참조하세요.