OPEN-SOURCE SCRIPT
Trend Setter Max Bars
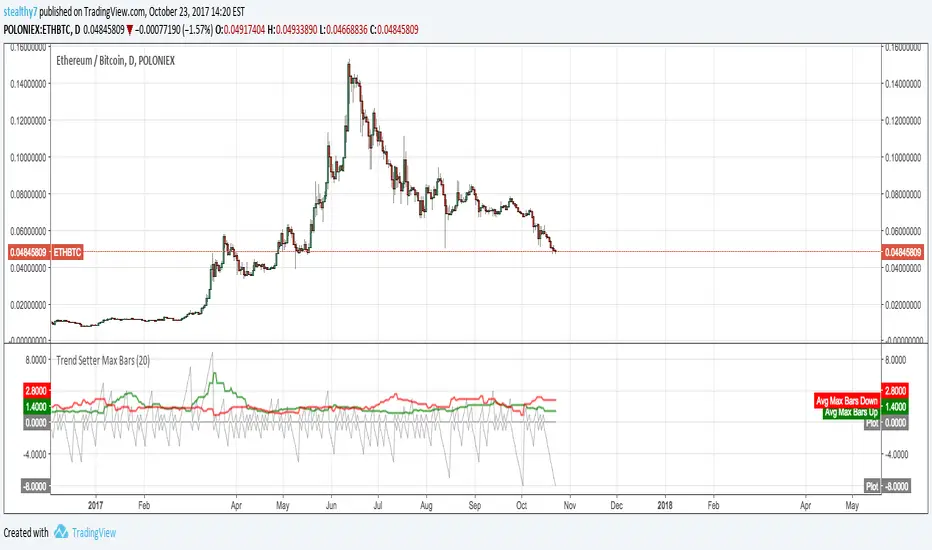
This script allows you to visualize trends. It counts continuous bars in the same direction, then makes an average of the maximum count in the look back period. If Green is above Red, its strength is upward and vice versa. This doesn't use returns or measure price moves.
*Positive Gray is current up bars count. Negative Gray down current down bars count
*Green and Red are average max counts.
This info could possibly be used to gauge trends or momentum.
Note: I finally figured out how to use loops and mutable variables in V3.
*Positive Gray is current up bars count. Negative Gray down current down bars count
*Green and Red are average max counts.
This info could possibly be used to gauge trends or momentum.
Note: I finally figured out how to use loops and mutable variables in V3.
오픈 소스 스크립트
트레이딩뷰의 진정한 정신에 따라, 이 스크립트의 작성자는 이를 오픈소스로 공개하여 트레이더들이 기능을 검토하고 검증할 수 있도록 했습니다. 작성자에게 찬사를 보냅니다! 이 코드는 무료로 사용할 수 있지만, 코드를 재게시하는 경우 하우스 룰이 적용된다는 점을 기억하세요.
면책사항
해당 정보와 게시물은 금융, 투자, 트레이딩 또는 기타 유형의 조언이나 권장 사항으로 간주되지 않으며, 트레이딩뷰에서 제공하거나 보증하는 것이 아닙니다. 자세한 내용은 이용 약관을 참조하세요.
오픈 소스 스크립트
트레이딩뷰의 진정한 정신에 따라, 이 스크립트의 작성자는 이를 오픈소스로 공개하여 트레이더들이 기능을 검토하고 검증할 수 있도록 했습니다. 작성자에게 찬사를 보냅니다! 이 코드는 무료로 사용할 수 있지만, 코드를 재게시하는 경우 하우스 룰이 적용된다는 점을 기억하세요.
면책사항
해당 정보와 게시물은 금융, 투자, 트레이딩 또는 기타 유형의 조언이나 권장 사항으로 간주되지 않으며, 트레이딩뷰에서 제공하거나 보증하는 것이 아닙니다. 자세한 내용은 이용 약관을 참조하세요.