PROTECTED SOURCE SCRIPT
업데이트됨 Rs Candlestick Indicator With Moving Averages
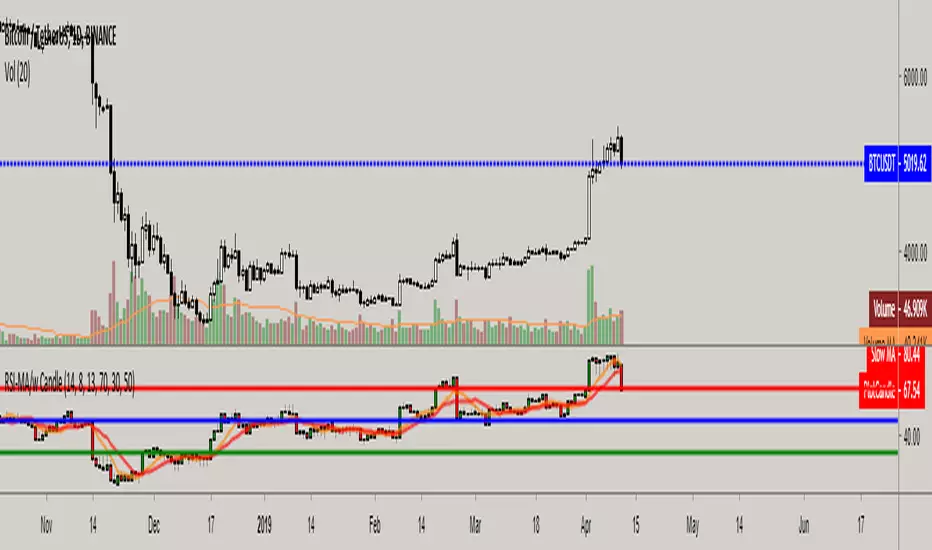
Unlike the traditional RSI, this one offers you an detailed insight with candlestick chart, rather than a simple line setup. It also includes two different customizable moving average(s) and offers detailed information such as bullish/bearish candlestick formations, negative and positive divergences on indicator.
How to use: Similar to candlestick charts, whenever Rsi candle close and stays above moving average(s) it's a buy signal and whenever candle closes below moving average(s), that's a sell signal. Rather than waiting for Rsi to break mid-line(50) to buy and sell, this one offers dynamic and more accurate buy and sell signals. You can also customize top-mid-bottom line values as well to determine overbought and oversold levels.
How to use: Similar to candlestick charts, whenever Rsi candle close and stays above moving average(s) it's a buy signal and whenever candle closes below moving average(s), that's a sell signal. Rather than waiting for Rsi to break mid-line(50) to buy and sell, this one offers dynamic and more accurate buy and sell signals. You can also customize top-mid-bottom line values as well to determine overbought and oversold levels.
릴리즈 노트
Added mid-line color.보호된 스크립트입니다
이 스크립트는 비공개 소스로 게시됩니다. 하지만 이를 자유롭게 제한 없이 사용할 수 있습니다 – 자세한 내용은 여기에서 확인하세요.
면책사항
해당 정보와 게시물은 금융, 투자, 트레이딩 또는 기타 유형의 조언이나 권장 사항으로 간주되지 않으며, 트레이딩뷰에서 제공하거나 보증하는 것이 아닙니다. 자세한 내용은 이용 약관을 참조하세요.
면책사항
해당 정보와 게시물은 금융, 투자, 트레이딩 또는 기타 유형의 조언이나 권장 사항으로 간주되지 않으며, 트레이딩뷰에서 제공하거나 보증하는 것이 아닙니다. 자세한 내용은 이용 약관을 참조하세요.