OPEN-SOURCE SCRIPT
Major & Modern Wars Timeline
Description:
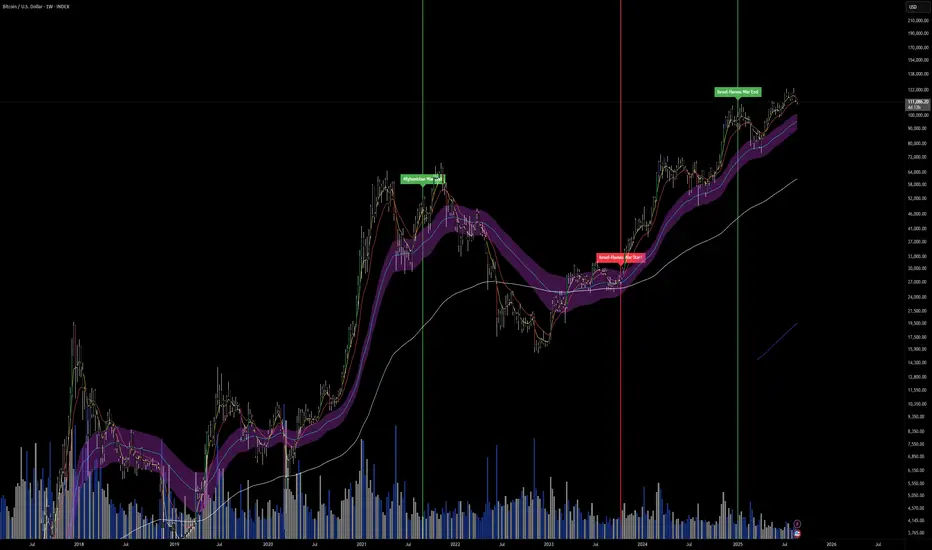
This indicator overlays vertical lines and labels on your chart to mark the start and end dates of major global wars and modern conflicts.
Features:
Displays start (red line + label) and end (green line + label) for each war.
Covers 20th century wars (World War I, World War II, Korean War, Vietnam War, Gulf War, Afghanistan, Iraq).
Includes modern conflicts: Syrian Civil War, Ukraine War, and Israel–Hamas War.
For ongoing conflicts, the end date is set to 2025 for timeline visualization.
Customizable: label position (above/below bar), line width.
Works on any chart timeframe, overlaying events on financial data.
Use case:
Useful for historical market analysis (e.g., gold, oil, S&P 500), helping traders and researchers see how wars and conflicts align with market movements.
오픈 소스 스크립트
트레이딩뷰의 진정한 정신에 따라, 이 스크립트의 작성자는 이를 오픈소스로 공개하여 트레이더들이 기능을 검토하고 검증할 수 있도록 했습니다. 작성자에게 찬사를 보냅니다! 이 코드는 무료로 사용할 수 있지만, 코드를 재게시하는 경우 하우스 룰이 적용된다는 점을 기억하세요.
면책사항
해당 정보와 게시물은 금융, 투자, 트레이딩 또는 기타 유형의 조언이나 권장 사항으로 간주되지 않으며, 트레이딩뷰에서 제공하거나 보증하는 것이 아닙니다. 자세한 내용은 이용 약관을 참조하세요.
오픈 소스 스크립트
트레이딩뷰의 진정한 정신에 따라, 이 스크립트의 작성자는 이를 오픈소스로 공개하여 트레이더들이 기능을 검토하고 검증할 수 있도록 했습니다. 작성자에게 찬사를 보냅니다! 이 코드는 무료로 사용할 수 있지만, 코드를 재게시하는 경우 하우스 룰이 적용된다는 점을 기억하세요.
면책사항
해당 정보와 게시물은 금융, 투자, 트레이딩 또는 기타 유형의 조언이나 권장 사항으로 간주되지 않으며, 트레이딩뷰에서 제공하거나 보증하는 것이 아닙니다. 자세한 내용은 이용 약관을 참조하세요.