PROTECTED SOURCE SCRIPT
Megazones
📦 Megazones — Auto-Expanding Range Detection
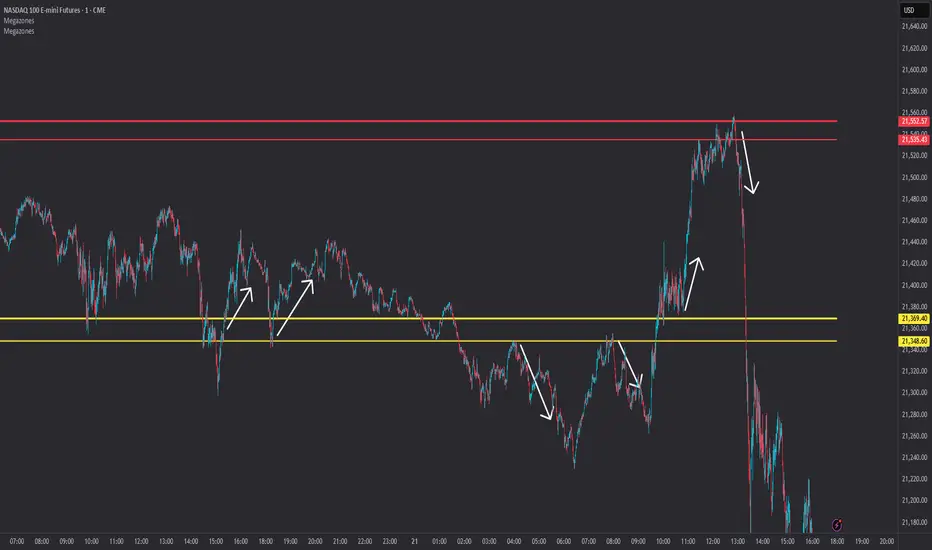
Megazones is a dynamic tool that detects price expansion ranges based on pivot structure. It automatically plots a pair of horizontal lines when both pivot highs and pivot lows are expanding — signaling directional strength and potential breakout zones.
🧠 How It Works:
- Pivot Detection: The script finds local highs/lows using a configurable Pivot Lookback length.
- Expansion Logic: It checks for consecutive higher highs and higher lows (configurable count).
- Zone Projection: When both expansions are detected, it draws a fading "zone" using two horizontal lines based on the latest pivot high and low.
⚙️ Settings:
- Pivot Lookback: How far left/right to confirm a pivot.
- Expansion Detection Window: How many bars back to keep pivots in memory.
- Min Expanding Highs/Lows: How many higher highs/lows must occur in a row to trigger zone detection.
🔍 Key Concept:
It identifies moments when the market is forming a structured expansion, where both higher highs and higher lows appear sequentially — suggesting potential breakout pressure or momentum continuation.
✅ Use Cases:
- Visual confirmation of building bullish structure.
- Anticipating breakout areas from clean expansion phases.
- Identifying trend-following continuation zones.
보호된 스크립트입니다
이 스크립트는 비공개 소스로 게시됩니다. 하지만 이를 자유롭게 제한 없이 사용할 수 있습니다 – 자세한 내용은 여기에서 확인하세요.
면책사항
해당 정보와 게시물은 금융, 투자, 트레이딩 또는 기타 유형의 조언이나 권장 사항으로 간주되지 않으며, 트레이딩뷰에서 제공하거나 보증하는 것이 아닙니다. 자세한 내용은 이용 약관을 참조하세요.
면책사항
해당 정보와 게시물은 금융, 투자, 트레이딩 또는 기타 유형의 조언이나 권장 사항으로 간주되지 않으며, 트레이딩뷰에서 제공하거나 보증하는 것이 아닙니다. 자세한 내용은 이용 약관을 참조하세요.