INVITE-ONLY SCRIPT
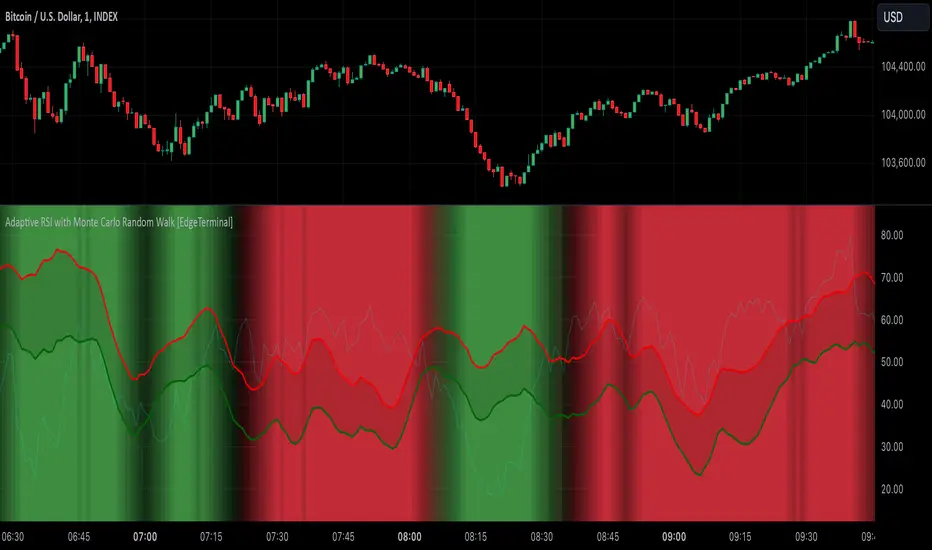
Adaptive RSI with Monte Carlo Random Walk [EdgeTerminal]
The Monte Carlo Random Walk RSI indicator revolutionizes the traditional RSI by replacing static overbought/oversold levels with dynamic, statistically-driven bands that adapt to market conditions. Enhanced with smooth transitions, visual cues, and advanced filtering, this indicator provides a sophisticated approach to market analysis.
How it works:
In this indicator, the machine learning simulation works by combining multiple market signals in a weighted system that adapts to market conditions. Instead of just using simple RSI overbought/oversold levels, it analyzes the relationships between RSI, price momentum, and volatility to generate a comprehensive score.
The RSI component contributes 40% to the final signal, while momentum and volatility each contribute 30%. These signals are normalized and combined to create a score between 0-100, similar to how a machine learning model would generate probability predictions.
When this score is very high (above 80) along with traditional RSI signals, it suggests a stronger likelihood of a price reversal than using RSI alone.
The indicator doesn't use actual Monte Carlo simulations, but it does incorporate the concept of probability through its scoring system. Rather than giving simple buy/sell signals, it provides different levels of conviction (strong vs weak signals) based on how multiple factors align.
For example, a strong buy signal only occurs when both the ML score is above 80 AND the RSI is in oversold territory, indicating that multiple market conditions are favorable. This multi-factor approach helps reduce false signals that might occur with traditional RSI and provides traders with more nuanced information about potential trade opportunities.
Key Innovations:
Dynamic Bands vs Static Levels: Traditional RSI uses fixed 70/30 or 80/20 levels, this adaptive RSI creates adaptive bands based on market behavior and automatically adjusts to volatility and trend changes to reduce false signals in trending markets.
1. Calculate price volatility: σ = stdDev(returns)
2. Generate random walks: R(t) = R(t-1) + N(0,σ)
3. Transform to RSI space
4. Create probability distribution
5. Extract confidence intervals
Statistical Analysis: We use Monte Carlo simulations to generate probability bands. This allows the indicator levels to automatically adapt to current market conditions, generating more accurate overbought and oversold levels.
1. Measure deviation: D = |RSI - nearestBand|
2. Normalize by volatility: N = D/ATR
3. Calculate strength multiplier: max(1, N)
The indicator uses Monte Carlo simulations to model potential RSI paths. For each simulation, we generate random returns using market volatility, then calculate RSI components, calculate RSI, and finally, repeat N times (default 200 simulations)
Settings:
RSI Length: Controls the lookback period for the RSI calculation. Higher values result in smoother RSI, and slower signals. It affects exponential smoothing factor, impacts volatility measurement and influences random walk generation.
Number of Simulations: Controls Monte Carlo simulation count. Higher values result in more accurate bands, but lower calculation. More simulation means you get a better normal distribution, reducing random variation in bands.
Confidence Level: this controls statistical significance of bands. Higher values result in wider bands, meaning fewer trading signals are generated.
- 0.95 = 95% confidence interval
- Captures 2 standard deviations
- Controls false signal probability
Band Smoothing: Applies SMA to raw band values. Higher values mean smoother brands but result in more lag.
Minimum Signal Strength: Normalizes RSI deviation by ATR. The higher the value, it requires stronger moves. It uses ATR for volatility normalization and creates standard deviation equivalent.
Trend Sensitivity: Measures trend strength relative to volatility. Higher values filter more trending conditions
Volume Threshold: Compares current volume to average. Higher values require stronger volume confirmation. It validates price movement and confirms institutional participation.
How to Use:
Background gradually turns red in overbought and turns green in oversold conditions. Based on your trade direction, you want to pay attention when overbought or oversold levels start shifting.
For example, if you're going long on a trade, wait for oversold conditions (green) to start shifting toward red, this can indicate a move into a long direction, helping you catch the trend.
Additionally, the bands represent statistically significant levels where the RSI is likely to reverse, based on recent market behavior. The indicator runs multiple simulations of potential RSI paths. Each simulation uses recent market volatility and characteristics, then creates a statistical distribution of where RSI tends to turn around.
The Upper Band (red line) represents a statistically significant overbought level, when RSI crosses above this band and stays there for a while, the background starts to turn red, indicating it's more extended than normal. This is a lot more reliable than fixed RSI 70 level because it adapts to market conditions. Finally, the probability of reversal increases above this band. You can think of it as a dynamic overbought level.
The Lower Band (green line) is the opposite of the red line, and it represents a statistically significant oversold level. When RSI crosses below this band, it's more oversold than normal. This is a lot more reliable than fixed RSI 30 level because it adapts to market trend and the probability of reversal increases below this band.
Finally, the band width itself represents how volatile the market is. A wider band means the market is more volatile and a narrower band means the market is not as volatile. The width automatically adjusts based on market conditions.
초대 전용 스크립트
이 스크립트는 작성자가 승인한 사용자만 접근할 수 있습니다. 사용하려면 요청 후 승인을 받아야 하며, 일반적으로 결제 후에 허가가 부여됩니다. 자세한 내용은 아래 작성자의 안내를 따르거나 EdgeTerminal에게 직접 문의하세요.
트레이딩뷰는 스크립트의 작동 방식을 충분히 이해하고 작성자를 완전히 신뢰하지 않는 이상, 해당 스크립트에 비용을 지불하거나 사용하는 것을 권장하지 않습니다. 커뮤니티 스크립트에서 무료 오픈소스 대안을 찾아보실 수도 있습니다.
작성자 지시 사항
If you're interested in using this script, please message us on Tradingview.
Indicators: etlnk.co/indicators
YouTube: youtube.com/@edgeterminal/
YouTube: youtube.com/@edgeterminal/
면책사항
해당 정보와 게시물은 금융, 투자, 트레이딩 또는 기타 유형의 조언이나 권장 사항으로 간주되지 않으며, 트레이딩뷰에서 제공하거나 보증하는 것이 아닙니다. 자세한 내용은 이용 약관을 참조하세요.