OPEN-SOURCE SCRIPT
Multi-Timeframe Bias by Atif Muzzammil
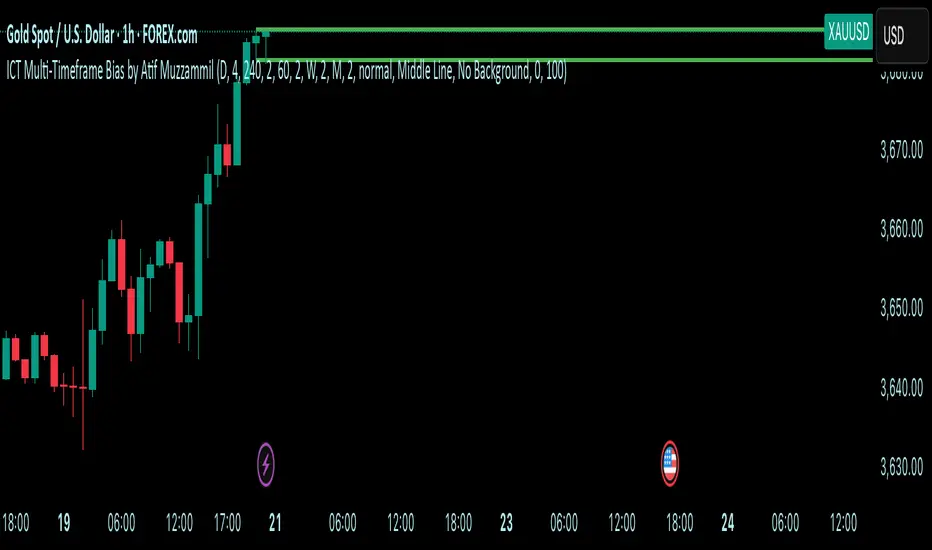
Multi-Timeframe Bias Indicator
This indicator implements multi TF bias concepts across multiple timeframes simultaneously. It identifies and displays bias levels.
Key Features:
Multi-Timeframe Analysis (Up to 5 Timeframes)
Supports all major timeframes: 5m, 15m, 30m, 1H, 4H, Daily, Weekly, Monthly
Each timeframe displays independently with customisable colors and line weights
Clean visual separation between different timeframe bias levels
ICT Bias Logic
Bearish Bias: Previous period close below the prior period's low
Bullish Bias: Previous period close above the prior period's high
Ranging Bias: Previous period close within the prior period's range
Draws horizontal lines at previous period's high and low levels
Advanced Customisation
Individual enable/disable for each timeframe
Custom colors and line thickness per timeframe
Comprehensive label settings with 4 position options
Adjustable label size, style (background/no background/text only)
Horizontal label positioning (0-100%) for optimal placement
Vertical offset controls for fine-tuning
Smart Detection
Automatic timeframe change detection using multiple methods
Enhanced detection for 4H, Weekly, and Monthly periods
Works correctly when viewing same timeframe as bias timeframe
Proper handling of market session boundaries
Clean Interface
Simple timeframe identification labels
Non-intrusive design that doesn't obstruct price action
Organized settings grouped by function
Debug mode available for troubleshooting
Compatible with all chart timeframes and works on any market that follows standard session timing.
오픈 소스 스크립트
트레이딩뷰의 진정한 정신에 따라, 이 스크립트의 작성자는 이를 오픈소스로 공개하여 트레이더들이 기능을 검토하고 검증할 수 있도록 했습니다. 작성자에게 찬사를 보냅니다! 이 코드는 무료로 사용할 수 있지만, 코드를 재게시하는 경우 하우스 룰이 적용된다는 점을 기억하세요.
면책사항
해당 정보와 게시물은 금융, 투자, 트레이딩 또는 기타 유형의 조언이나 권장 사항으로 간주되지 않으며, 트레이딩뷰에서 제공하거나 보증하는 것이 아닙니다. 자세한 내용은 이용 약관을 참조하세요.
오픈 소스 스크립트
트레이딩뷰의 진정한 정신에 따라, 이 스크립트의 작성자는 이를 오픈소스로 공개하여 트레이더들이 기능을 검토하고 검증할 수 있도록 했습니다. 작성자에게 찬사를 보냅니다! 이 코드는 무료로 사용할 수 있지만, 코드를 재게시하는 경우 하우스 룰이 적용된다는 점을 기억하세요.
면책사항
해당 정보와 게시물은 금융, 투자, 트레이딩 또는 기타 유형의 조언이나 권장 사항으로 간주되지 않으며, 트레이딩뷰에서 제공하거나 보증하는 것이 아닙니다. 자세한 내용은 이용 약관을 참조하세요.