PROTECTED SOURCE SCRIPT
Super curved trend session forecast [CLEVER]
📊✨ Super curved trend [CLEVER] 🔮
The Future of Trend Prediction, Visualized.
🔥Super curved trend session forecast [CLEVER] is not just another trend indicator — it’s a high-precision forecasting system engineered to decode how long trends truly last, how strong they are, and when they are most likely to fade away.
Built using a fusion of Hull Moving Average (HMA), Curved Radius Supertrend, CLEVER Streak Analytics, this advanced Pine Script tool goes far beyond simple color changes — it analyzes, measures, and predicts market rhythm in real-time.
🧠 Core Concept:
Every market has a pulse — trends form, rise, and eventually die out.
The Trend Duration Forecast identifies the beginning of a new bullish 🟢 or bearish 🔴 phase, tracks its strength and slope, and then intelligently forecasts the probable continuation length ⏳ of that trend based on the historical average of previous movements.
When a new phase begins, the indicator automatically projects forward — showing how far the current trend can statistically go before exhaustion.
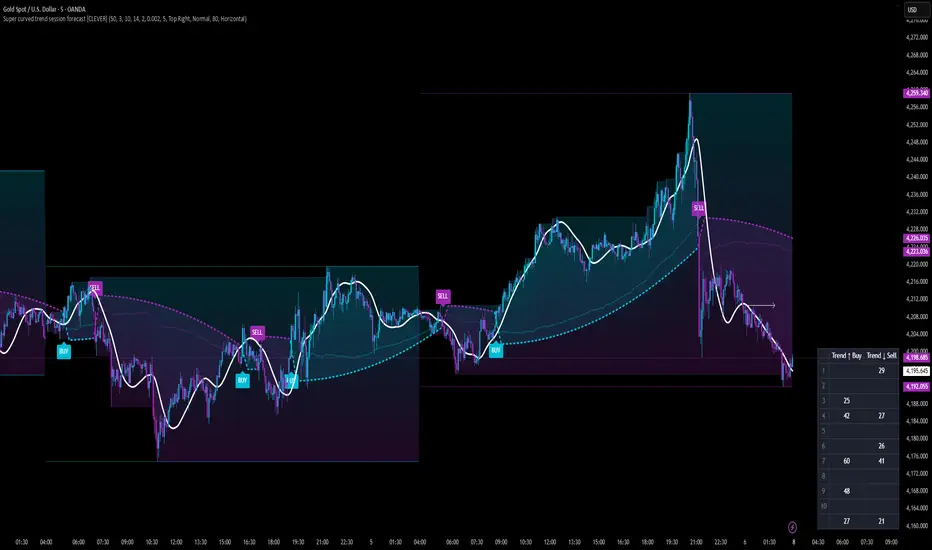
It also visually marks potential BUY 🟩 or SELL 🟥 zones with projected boundaries, helping traders anticipate not just what direction the market is going — but for how long.

 BTCUSD
  USOIL
USOIL  XAUUSD
 EURCHF
⚙️ Technical Architecture:
🧩 1. Hull Moving Average (HMA):
The heart of the system. It reacts faster than a standard MA but remains smooth enough to filter out false spikes. HMA’s slope determines the active trend phase and strength gradient.
🌀 2. Supertrend:
A next-gen enhancement to the classic Supertrend. Instead of linear lines, it uses curved ATR-based support and resistance paths that bend with price acceleration — giving you a dynamic visual flow of market structure and reducing whipsaws in volatile sessions.
📈 3. CLEVER Session
XAUUSD
USDCNH
GBPMXN
USDCHF
USOIL
EURUSD
DXY
BTCUSD
snapshot
Analytics:
Borrowed from high-end statistical modules, this tracks how many sessions have been consecutively bullish or bearish — revealing hidden rhythm patterns and market exhaustion points.
It also provides median, mode, and count streak data in a clean, optional dashboard overlay.
🎨 Visuals & Display:
✨ Color-coded candles change with trend state for instant clarity.
📊 Adaptive projection lines show trend duration zones and forecast targets.
🧾 A detailed Trend Duration Table lists the average length of past bullish/bearish runs, enabling data-backed decisions.
🔍 Smooth dynamic curvature ensures the chart looks clean yet highly responsive — ideal for both analysis and presentation.
💡 Practical Benefits:
✅ Forecast Continuation: Know how long your current trend is statistically likely to last before it weakens.
✅ Early Reversal Alerts: Identify when a new bullish or bearish phase is starting before the crowd.
✅ Smart Timing: Align your entries/exits with historical rhythm rather than random volatility.
✅ Visual Precision: Instantly recognize strength, direction, and duration from adaptive curves and color-coded visuals.
✅ Data-Driven Confidence: Trade with statistical context, not just visual cues.
🧭 Ideal For:
💥 Swing Traders – time your trades at the start of trend cycles.
⚡ Scalpers & Intraday Traders – catch short-term momentum while avoiding fake-outs.
🤖 Algorithmic Traders – integrate statistical forecasting into automated strategies.
📉 Market Analysts – visually present complex data in a digestible, story-driven way.
🧠 In Essences combines trend detection, duration prediction, and volatility curvature modeling into one seamless system.
It’s designed to make you see trends not just as lines — but as living patterns with measurable lifespans.
With this tool, you no longer trade reactively —
You trade intelligently, early, and with foresight. 🔥
🏁 Summary:
🔹 Advanced HMA-based trend detection
🔹 Dynamic Curved Radius Supertrend support/resistance
🔹 Statistical trend duration forecasting
🔹 CLEVER streak analytics module
🔹 BUY/SELL projection zones
🔹 Adaptive color-coded candles
🔹 On-chart dashboard + historical duration table
🚀 The future of precision trend analysis is Super curved trend session forecast [CLEVER] —
See the trend. Measure its life. Predict its end. 🌙📈
The Future of Trend Prediction, Visualized.
🔥Super curved trend session forecast [CLEVER] is not just another trend indicator — it’s a high-precision forecasting system engineered to decode how long trends truly last, how strong they are, and when they are most likely to fade away.
Built using a fusion of Hull Moving Average (HMA), Curved Radius Supertrend, CLEVER Streak Analytics, this advanced Pine Script tool goes far beyond simple color changes — it analyzes, measures, and predicts market rhythm in real-time.
🧠 Core Concept:
Every market has a pulse — trends form, rise, and eventually die out.
The Trend Duration Forecast identifies the beginning of a new bullish 🟢 or bearish 🔴 phase, tracks its strength and slope, and then intelligently forecasts the probable continuation length ⏳ of that trend based on the historical average of previous movements.
When a new phase begins, the indicator automatically projects forward — showing how far the current trend can statistically go before exhaustion.
It also visually marks potential BUY 🟩 or SELL 🟥 zones with projected boundaries, helping traders anticipate not just what direction the market is going — but for how long.
⚙️ Technical Architecture:
🧩 1. Hull Moving Average (HMA):
The heart of the system. It reacts faster than a standard MA but remains smooth enough to filter out false spikes. HMA’s slope determines the active trend phase and strength gradient.
🌀 2. Supertrend:
A next-gen enhancement to the classic Supertrend. Instead of linear lines, it uses curved ATR-based support and resistance paths that bend with price acceleration — giving you a dynamic visual flow of market structure and reducing whipsaws in volatile sessions.
📈 3. CLEVER Session
XAUUSD
USDCNH
GBPMXN
USDCHF
USOIL
EURUSD
DXY
BTCUSD
snapshot
Analytics:
Borrowed from high-end statistical modules, this tracks how many sessions have been consecutively bullish or bearish — revealing hidden rhythm patterns and market exhaustion points.
It also provides median, mode, and count streak data in a clean, optional dashboard overlay.
🎨 Visuals & Display:
✨ Color-coded candles change with trend state for instant clarity.
📊 Adaptive projection lines show trend duration zones and forecast targets.
🧾 A detailed Trend Duration Table lists the average length of past bullish/bearish runs, enabling data-backed decisions.
🔍 Smooth dynamic curvature ensures the chart looks clean yet highly responsive — ideal for both analysis and presentation.
💡 Practical Benefits:
✅ Forecast Continuation: Know how long your current trend is statistically likely to last before it weakens.
✅ Early Reversal Alerts: Identify when a new bullish or bearish phase is starting before the crowd.
✅ Smart Timing: Align your entries/exits with historical rhythm rather than random volatility.
✅ Visual Precision: Instantly recognize strength, direction, and duration from adaptive curves and color-coded visuals.
✅ Data-Driven Confidence: Trade with statistical context, not just visual cues.
🧭 Ideal For:
💥 Swing Traders – time your trades at the start of trend cycles.
⚡ Scalpers & Intraday Traders – catch short-term momentum while avoiding fake-outs.
🤖 Algorithmic Traders – integrate statistical forecasting into automated strategies.
📉 Market Analysts – visually present complex data in a digestible, story-driven way.
🧠 In Essences combines trend detection, duration prediction, and volatility curvature modeling into one seamless system.
It’s designed to make you see trends not just as lines — but as living patterns with measurable lifespans.
With this tool, you no longer trade reactively —
You trade intelligently, early, and with foresight. 🔥
🏁 Summary:
🔹 Advanced HMA-based trend detection
🔹 Dynamic Curved Radius Supertrend support/resistance
🔹 Statistical trend duration forecasting
🔹 CLEVER streak analytics module
🔹 BUY/SELL projection zones
🔹 Adaptive color-coded candles
🔹 On-chart dashboard + historical duration table
🚀 The future of precision trend analysis is Super curved trend session forecast [CLEVER] —
See the trend. Measure its life. Predict its end. 🌙📈
보호된 스크립트입니다
이 스크립트는 비공개 소스로 게시됩니다. 하지만 이를 자유롭게 제한 없이 사용할 수 있습니다 – 자세한 내용은 여기에서 확인하세요.
면책사항
해당 정보와 게시물은 금융, 투자, 트레이딩 또는 기타 유형의 조언이나 권장 사항으로 간주되지 않으며, 트레이딩뷰에서 제공하거나 보증하는 것이 아닙니다. 자세한 내용은 이용 약관을 참조하세요.
보호된 스크립트입니다
이 스크립트는 비공개 소스로 게시됩니다. 하지만 이를 자유롭게 제한 없이 사용할 수 있습니다 – 자세한 내용은 여기에서 확인하세요.
면책사항
해당 정보와 게시물은 금융, 투자, 트레이딩 또는 기타 유형의 조언이나 권장 사항으로 간주되지 않으며, 트레이딩뷰에서 제공하거나 보증하는 것이 아닙니다. 자세한 내용은 이용 약관을 참조하세요.