OPEN-SOURCE SCRIPT
Yearly Performance Table with CAGR
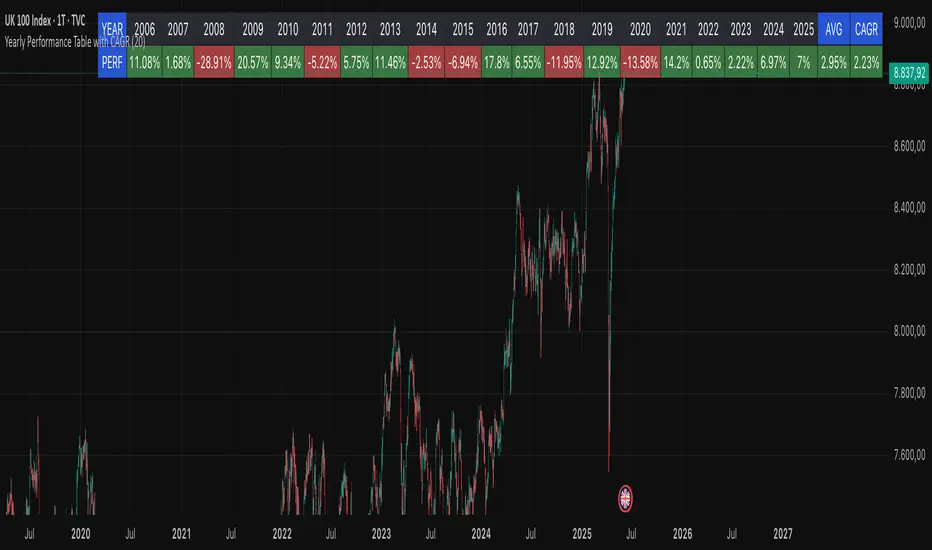
Overview
This Pine Script indicator provides a clear table displaying the annual performance of an asset, along with two different average metrics: the arithmetic mean and the geometric mean (CAGR).
Core Features
Annual Performance Calculation:
Automatically detects the first trading day of each calendar year.
Calculates the percentage return for each full calendar year.
Based on closing prices from the first to the last trading day of the respective year.
Flexible Display:
Adjustable Period: Displays data for 1-50 years (default: 10 years).
Daily Timeframe Only: Functions exclusively on daily charts.
Automatic Update: Always shows the latest available years.
Two Average Metrics:
AVG (Arithmetic Mean)
A simple average of all annual returns. (Formula: (R₁ + R₂ + ... + Rₙ) ÷ n)
Important: Can be misleading in the presence of volatile returns.
GEO (Geometric Mean / CAGR)
Compound Annual Growth Rate. (Formula: [(1+R₁) × (1+R₂) × ... × (1+Rₙ)]^(1/n) - 1)
Represents the true average annual growth rate.
Fully accounts for the compounding effect.
Limitations
Daily Charts Only: Does not work on intraday or weekly/monthly timeframes.
Calendar Year Basis: Calculations are based on calendar years, not rolling 12-month periods.
Historical Data: Dependent on the availability of historical data from the broker/data provider.
Interpretation of Results
CAGR as Benchmark: The geometric mean is more suitable for performance comparisons.
Annual Patterns: Individual year figures can reveal seasonal or cyclical trends.
오픈 소스 스크립트
트레이딩뷰의 진정한 정신에 따라, 이 스크립트의 작성자는 이를 오픈소스로 공개하여 트레이더들이 기능을 검토하고 검증할 수 있도록 했습니다. 작성자에게 찬사를 보냅니다! 이 코드는 무료로 사용할 수 있지만, 코드를 재게시하는 경우 하우스 룰이 적용된다는 점을 기억하세요.
면책사항
해당 정보와 게시물은 금융, 투자, 트레이딩 또는 기타 유형의 조언이나 권장 사항으로 간주되지 않으며, 트레이딩뷰에서 제공하거나 보증하는 것이 아닙니다. 자세한 내용은 이용 약관을 참조하세요.
오픈 소스 스크립트
트레이딩뷰의 진정한 정신에 따라, 이 스크립트의 작성자는 이를 오픈소스로 공개하여 트레이더들이 기능을 검토하고 검증할 수 있도록 했습니다. 작성자에게 찬사를 보냅니다! 이 코드는 무료로 사용할 수 있지만, 코드를 재게시하는 경우 하우스 룰이 적용된다는 점을 기억하세요.
면책사항
해당 정보와 게시물은 금융, 투자, 트레이딩 또는 기타 유형의 조언이나 권장 사항으로 간주되지 않으며, 트레이딩뷰에서 제공하거나 보증하는 것이 아닙니다. 자세한 내용은 이용 약관을 참조하세요.