OPEN-SOURCE SCRIPT
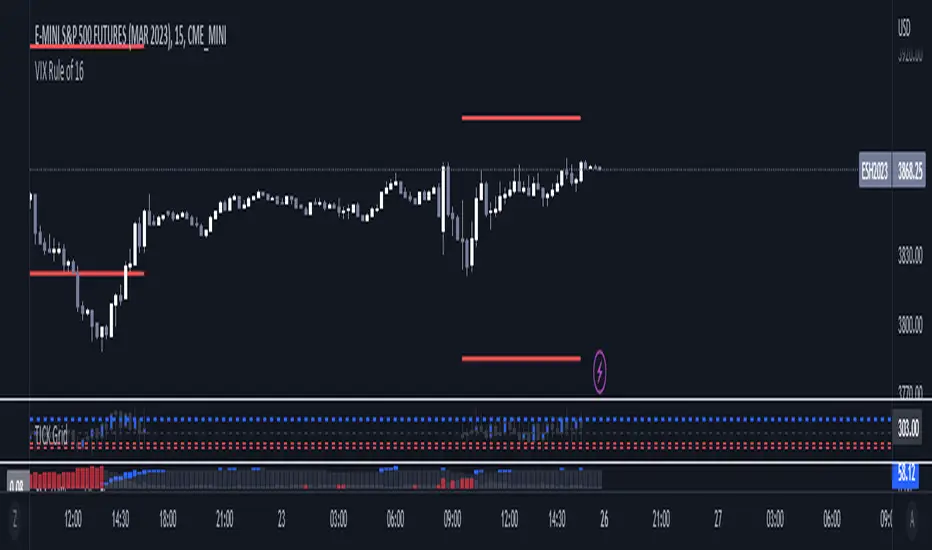
VIX Rule of 16

There’s an interesting aspect of VIX that has to do with the number 16. (approximately the square root of the number of trading days in a year).
In any statistical model, 68.2% of price movement falls within one standard deviation (1 SD ). The rest falls into the “tails” outside of 1 SD .
When you divide any implied volatility (IV) reading (such as VIX ) by 16, the annualized number becomes a daily number
The essence of the “rule of 16.” Once you get it, you can do all sorts of tricks with it.
If the VIX is trading at 16, then one-third of the time, the market expects the S&P 500 Index (SPX) to trade up or down by more than 1% (because 16/16=1). A VIX at 32 suggests a move up or down of more than 2% a third of the time, and so on.
• VIX of 16 – 1/3 of the time the SPX will have a daily change of at least 1%
• VIX of 32 – 1/3 of the time the SPX will have a daily change of at least 2%
• VIX of 48 – 1/3 of the time the SPX will have a daily change of at least 3%
오픈 소스 스크립트
트레이딩뷰의 진정한 정신에 따라, 이 스크립트의 작성자는 이를 오픈소스로 공개하여 트레이더들이 기능을 검토하고 검증할 수 있도록 했습니다. 작성자에게 찬사를 보냅니다! 이 코드는 무료로 사용할 수 있지만, 코드를 재게시하는 경우 하우스 룰이 적용된다는 점을 기억하세요.
면책사항
해당 정보와 게시물은 금융, 투자, 트레이딩 또는 기타 유형의 조언이나 권장 사항으로 간주되지 않으며, 트레이딩뷰에서 제공하거나 보증하는 것이 아닙니다. 자세한 내용은 이용 약관을 참조하세요.
오픈 소스 스크립트
트레이딩뷰의 진정한 정신에 따라, 이 스크립트의 작성자는 이를 오픈소스로 공개하여 트레이더들이 기능을 검토하고 검증할 수 있도록 했습니다. 작성자에게 찬사를 보냅니다! 이 코드는 무료로 사용할 수 있지만, 코드를 재게시하는 경우 하우스 룰이 적용된다는 점을 기억하세요.
면책사항
해당 정보와 게시물은 금융, 투자, 트레이딩 또는 기타 유형의 조언이나 권장 사항으로 간주되지 않으며, 트레이딩뷰에서 제공하거나 보증하는 것이 아닙니다. 자세한 내용은 이용 약관을 참조하세요.