PROTECTED SOURCE SCRIPT
Buy On Dip
This Setup Show When To Buy On Dip. (not 100% working, just as guidance)
The idea is combined from other script (thanks to all scriptwriter) and modified by me.
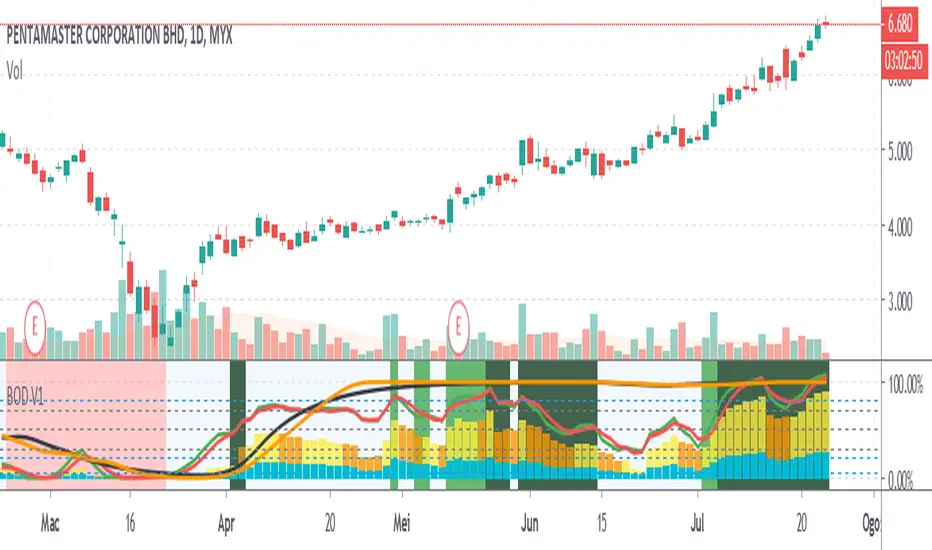
Main Idea Line and Histogram are derived and modified by:
1. Stochastic RSI ( red and green)
2. Ema/Sma ( Black and orange)
how to interpret same as default Stochastic Rsi.
For Histogram:
If Blue above line 5%, Bullish indicator and;
If Yellow appear stronger the Bullish Sign,
If No bar above blue histogram, it indicate sideway and want to go bearish.
If Orange bar appear show the bullish is weak.
Entry when the back ground is not red.
Buy on Dip entry when the blue and yellow histogram color just appear. (not 100% working, just as guidance)
The darker the background color mean the strong uptrend.
Tested At Stock Market Bursa Malaysia, maybe can use at FOREX.
The idea is combined from other script (thanks to all scriptwriter) and modified by me.
Main Idea Line and Histogram are derived and modified by:
1. Stochastic RSI ( red and green)
2. Ema/Sma ( Black and orange)
how to interpret same as default Stochastic Rsi.
For Histogram:
If Blue above line 5%, Bullish indicator and;
If Yellow appear stronger the Bullish Sign,
If No bar above blue histogram, it indicate sideway and want to go bearish.
If Orange bar appear show the bullish is weak.
Entry when the back ground is not red.
Buy on Dip entry when the blue and yellow histogram color just appear. (not 100% working, just as guidance)
The darker the background color mean the strong uptrend.
Tested At Stock Market Bursa Malaysia, maybe can use at FOREX.
보호된 스크립트입니다
이 스크립트는 비공개 소스로 게시됩니다. 하지만 이를 자유롭게 제한 없이 사용할 수 있습니다 – 자세한 내용은 여기에서 확인하세요.
면책사항
해당 정보와 게시물은 금융, 투자, 트레이딩 또는 기타 유형의 조언이나 권장 사항으로 간주되지 않으며, 트레이딩뷰에서 제공하거나 보증하는 것이 아닙니다. 자세한 내용은 이용 약관을 참조하세요.
면책사항
해당 정보와 게시물은 금융, 투자, 트레이딩 또는 기타 유형의 조언이나 권장 사항으로 간주되지 않으며, 트레이딩뷰에서 제공하거나 보증하는 것이 아닙니다. 자세한 내용은 이용 약관을 참조하세요.