OPEN-SOURCE SCRIPT
업데이트됨 Bias Table
Overview
The Bias Table Indicator is a multi-timeframe analysis tool designed to provide a quick sentiment overview across multiple timeframes. It combines signals from Moving Averages (MAs) and Oscillators to determine market bias, helping traders make more informed decisions.
Key Features
✔ Multi-Timeframe Analysis (MTF) – Displays market bias across up to five timeframes.
✔ Customizable Signals – Choose whether bias is based on Moving Averages (MAs), Oscillators, or a combination of both.
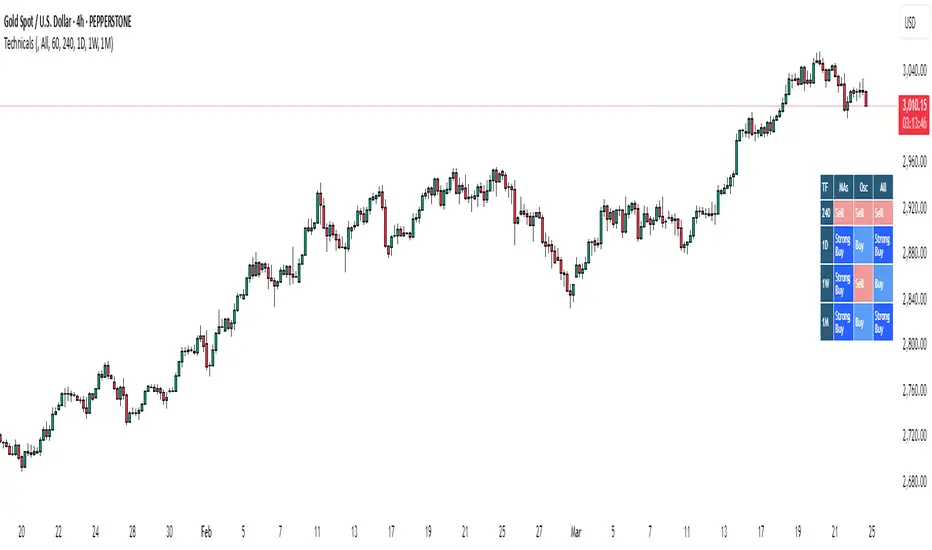
✔ Visual Table Format – The indicator presents the bias as a color-coded table in the bottom-right corner of the chart for quick reference.
✔ Adjustable Colors & Display Settings – Users can customize colors for different sentiment states (Strong Buy, Buy, Neutral, Sell, Strong Sell).
How It Works
Bias Calculation: The indicator evaluates market conditions using preset values (which can be replaced with actual logic) to determine sentiment for each timeframe.
Multi-Timeframe Support: The table can display bias from hourly to monthly timeframes, giving traders a broader view of market conditions.
Customizable Signals: Users can filter the table to show bias based only on MAs, Oscillators, or a combination of both.
Interpreting the Table
📊 Timeframes: The leftmost column shows selected timeframes (e.g., 1H, 4H, 1D, 1W, 1M).
📈 Signal Columns:
MAs – Bias based on Moving Averages.
Oscillators – Bias based on momentum indicators like RSI, Stochastics, etc.
All – A combined bias based on both MAs & Oscillators.
🚦 Color-Coded Ratings:
🔵 Strong Buy – High bullish strength.
🔹 Buy – Moderate bullish sentiment.
⚪ Neutral – No clear trend.
🔸 Sell – Moderate bearish sentiment.
🔴 Strong Sell – High bearish strength.
Best Used For:
📈 Trend Confirmation: Validate signals from your primary strategy.
⏳ Multi-Timeframe Analysis: See whether short-term and long-term trends align.
⚡ Quick Sentiment Check: Get a high-level view of market conditions without analyzing multiple indicators separately.
Customization Options:
Select which timeframes to include in the table.
Choose whether to base bias on MAs, Oscillators, or both.
Adjust colors for each signal type.
The Bias Table Indicator is a multi-timeframe analysis tool designed to provide a quick sentiment overview across multiple timeframes. It combines signals from Moving Averages (MAs) and Oscillators to determine market bias, helping traders make more informed decisions.
Key Features
✔ Multi-Timeframe Analysis (MTF) – Displays market bias across up to five timeframes.
✔ Customizable Signals – Choose whether bias is based on Moving Averages (MAs), Oscillators, or a combination of both.
✔ Visual Table Format – The indicator presents the bias as a color-coded table in the bottom-right corner of the chart for quick reference.
✔ Adjustable Colors & Display Settings – Users can customize colors for different sentiment states (Strong Buy, Buy, Neutral, Sell, Strong Sell).
How It Works
Bias Calculation: The indicator evaluates market conditions using preset values (which can be replaced with actual logic) to determine sentiment for each timeframe.
Multi-Timeframe Support: The table can display bias from hourly to monthly timeframes, giving traders a broader view of market conditions.
Customizable Signals: Users can filter the table to show bias based only on MAs, Oscillators, or a combination of both.
Interpreting the Table
📊 Timeframes: The leftmost column shows selected timeframes (e.g., 1H, 4H, 1D, 1W, 1M).
📈 Signal Columns:
MAs – Bias based on Moving Averages.
Oscillators – Bias based on momentum indicators like RSI, Stochastics, etc.
All – A combined bias based on both MAs & Oscillators.
🚦 Color-Coded Ratings:
🔵 Strong Buy – High bullish strength.
🔹 Buy – Moderate bullish sentiment.
⚪ Neutral – No clear trend.
🔸 Sell – Moderate bearish sentiment.
🔴 Strong Sell – High bearish strength.
Best Used For:
📈 Trend Confirmation: Validate signals from your primary strategy.
⏳ Multi-Timeframe Analysis: See whether short-term and long-term trends align.
⚡ Quick Sentiment Check: Get a high-level view of market conditions without analyzing multiple indicators separately.
Customization Options:
Select which timeframes to include in the table.
Choose whether to base bias on MAs, Oscillators, or both.
Adjust colors for each signal type.
릴리즈 노트
OverviewThe Bias Table Indicator is a multi-timeframe analysis tool designed to provide a quick sentiment overview across multiple timeframes. It combines signals from Moving Averages (MAs) and Oscillators to determine market bias, helping traders make more informed decisions.
Key Features
✔ Multi-Timeframe Analysis (MTF) – Displays market bias across up to five timeframes.
✔ Customizable Signals – Choose whether bias is based on Moving Averages (MAs), Oscillators, or a combination of both.
✔ Visual Table Format – The indicator presents the bias as a color-coded table in the bottom-right corner of the chart for quick reference.
✔ Adjustable Colors & Display Settings – Users can customize colors for different sentiment states (Strong Buy, Buy, Neutral, Sell, Strong Sell).
How It Works
Bias Calculation: The indicator evaluates market conditions using preset values (which can be replaced with actual logic) to determine sentiment for each timeframe.
Multi-Timeframe Support: The table can display bias from hourly to monthly timeframes, giving traders a broader view of market conditions.
Customizable Signals: Users can filter the table to show bias based only on MAs, Oscillators, or a combination of both.
Interpreting the Table
📊 Timeframes: The leftmost column shows selected timeframes (e.g., 1H, 4H, 1D, 1W, 1M).
📈 Signal Columns:
MAs – Bias based on Moving Averages.
Oscillators – Bias based on momentum indicators like RSI, Stochastics, etc.
All – A combined bias based on both MAs & Oscillators.
🚦 Color-Coded Ratings:
🔵 Strong Buy – High bullish strength.
🔹 Buy – Moderate bullish sentiment.
⚪ Neutral – No clear trend.
🔸 Sell – Moderate bearish sentiment.
🔴 Strong Sell – High bearish strength.
Best Used For:
📈 Trend Confirmation: Validate signals from your primary strategy.
⏳ Multi-Timeframe Analysis: See whether short-term and long-term trends align.
⚡ Quick Sentiment Check: Get a high-level view of market conditions without analyzing multiple indicators separately.
Customization Options:
Select which timeframes to include in the table.
Choose whether to base bias on MAs, Oscillators, or both.
Adjust colors for each signal type.
오픈 소스 스크립트
트레이딩뷰의 진정한 정신에 따라, 이 스크립트의 작성자는 이를 오픈소스로 공개하여 트레이더들이 기능을 검토하고 검증할 수 있도록 했습니다. 작성자에게 찬사를 보냅니다! 이 코드는 무료로 사용할 수 있지만, 코드를 재게시하는 경우 하우스 룰이 적용된다는 점을 기억하세요.
면책사항
해당 정보와 게시물은 금융, 투자, 트레이딩 또는 기타 유형의 조언이나 권장 사항으로 간주되지 않으며, 트레이딩뷰에서 제공하거나 보증하는 것이 아닙니다. 자세한 내용은 이용 약관을 참조하세요.
오픈 소스 스크립트
트레이딩뷰의 진정한 정신에 따라, 이 스크립트의 작성자는 이를 오픈소스로 공개하여 트레이더들이 기능을 검토하고 검증할 수 있도록 했습니다. 작성자에게 찬사를 보냅니다! 이 코드는 무료로 사용할 수 있지만, 코드를 재게시하는 경우 하우스 룰이 적용된다는 점을 기억하세요.
면책사항
해당 정보와 게시물은 금융, 투자, 트레이딩 또는 기타 유형의 조언이나 권장 사항으로 간주되지 않으며, 트레이딩뷰에서 제공하거나 보증하는 것이 아닙니다. 자세한 내용은 이용 약관을 참조하세요.