PROTECTED SOURCE SCRIPT
GG [AYC]
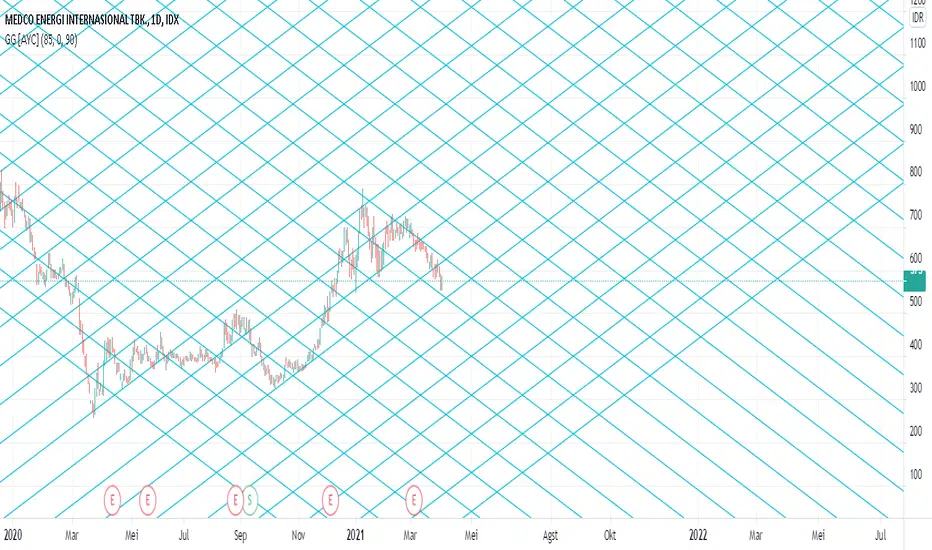
This indicator basically works like Gann Grid indicator that can be used as an SNR , making it easier to draw diagonal lines with the same price difference for each line.
The change in SNR in a market can be in the form of a certain gap/point number according to its characteristics.
Entering these numbers can make it easier for traders to determine SNR for better profit.
How to use :
1.Enter "Price" (Extreme Low)
2.Enter "Price Step" (It doesn't really important, just in case the line is not enough, because tradingview has limitations in plotting lines), Default is "0" & Step is "270"
3.Enter "Point" that you want as SNR , 90 is the default for the stock market.
4.Choose "Start"
Start = The start date of the cycle of price movements
5.Choose "End"
End = The end date of the cycle of price movements
보호된 스크립트입니다
이 스크립트는 비공개 소스로 게시됩니다. 하지만 이를 자유롭게 제한 없이 사용할 수 있습니다 – 자세한 내용은 여기에서 확인하세요.
면책사항
해당 정보와 게시물은 금융, 투자, 트레이딩 또는 기타 유형의 조언이나 권장 사항으로 간주되지 않으며, 트레이딩뷰에서 제공하거나 보증하는 것이 아닙니다. 자세한 내용은 이용 약관을 참조하세요.
보호된 스크립트입니다
이 스크립트는 비공개 소스로 게시됩니다. 하지만 이를 자유롭게 제한 없이 사용할 수 있습니다 – 자세한 내용은 여기에서 확인하세요.
면책사항
해당 정보와 게시물은 금융, 투자, 트레이딩 또는 기타 유형의 조언이나 권장 사항으로 간주되지 않으며, 트레이딩뷰에서 제공하거나 보증하는 것이 아닙니다. 자세한 내용은 이용 약관을 참조하세요.