PROTECTED SOURCE SCRIPT
Kustom Session Hi/Lo
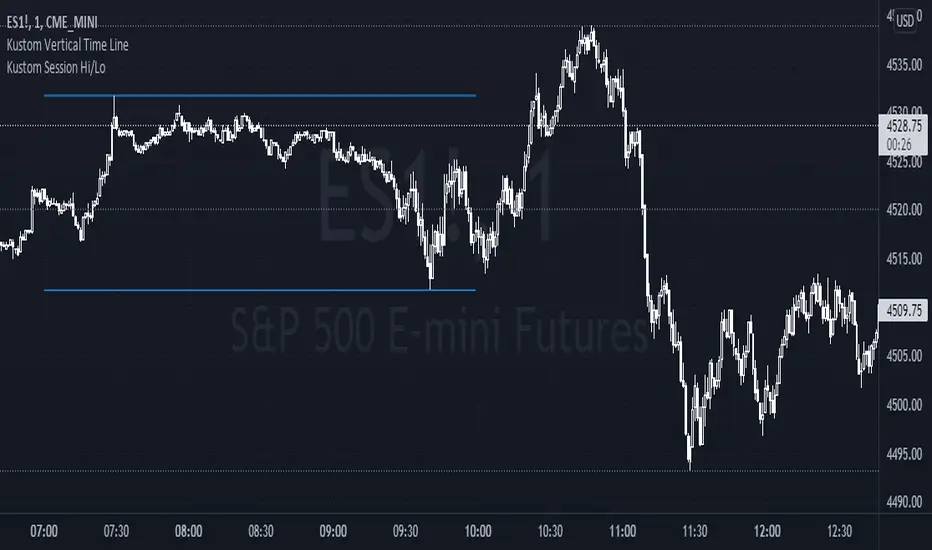
Plots the High and Low prices set between the time(s) of the user's input
The time parameters can be used for known session times or the user can define a custom time frame they deem valuable.
Highs & Lows during specific time frames can serve as an indication of the market's intent.
Having visual line(s) showing these changes in market direction allows the user the frame out market structure for key changes in market direction.
The mid-line option will also give the user an indication of whether or not price is at a premium or discount based on the direction of the market.
Settings:
A. Start Time - End Time
B. Line Weight
C. Line Color
D. Mid-line color
보호된 스크립트입니다
이 스크립트는 비공개 소스로 게시됩니다. 하지만 이를 자유롭게 제한 없이 사용할 수 있습니다 – 자세한 내용은 여기에서 확인하세요.
면책사항
해당 정보와 게시물은 금융, 투자, 트레이딩 또는 기타 유형의 조언이나 권장 사항으로 간주되지 않으며, 트레이딩뷰에서 제공하거나 보증하는 것이 아닙니다. 자세한 내용은 이용 약관을 참조하세요.
보호된 스크립트입니다
이 스크립트는 비공개 소스로 게시됩니다. 하지만 이를 자유롭게 제한 없이 사용할 수 있습니다 – 자세한 내용은 여기에서 확인하세요.
면책사항
해당 정보와 게시물은 금융, 투자, 트레이딩 또는 기타 유형의 조언이나 권장 사항으로 간주되지 않으며, 트레이딩뷰에서 제공하거나 보증하는 것이 아닙니다. 자세한 내용은 이용 약관을 참조하세요.