OPEN-SOURCE SCRIPT
Smooth Price Oscillator [BigBeluga]
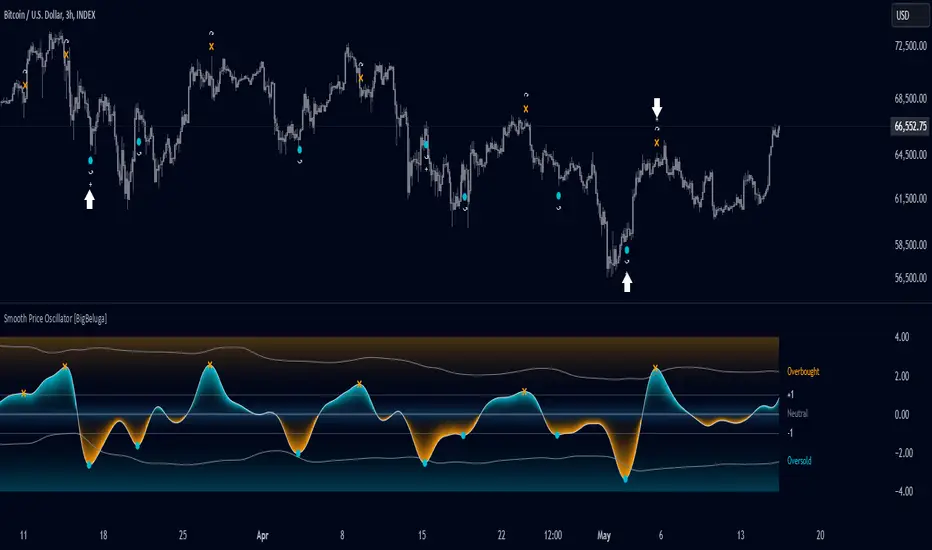
The Smooth Price Oscillator by BigBeluga leverages John Ehlers' SuperSmoother filter to produce a clear and smooth oscillator for identifying market trends and mean reversion points. By filtering price data over two distinct periods, this indicator effectively removes noise, allowing traders to focus on significant signals without the clutter of market fluctuations.
🔵 KEY FEATURES & USAGE
● SuperSmoother-Based Oscillator:
This oscillator uses Ehlers' SuperSmoother filter, applied to two different periods, to create a smooth output that highlights price momentum and reduces market noise. The dual-period application enables a comparison of long-term and short-term price movements, making it suitable for both trend-following and reversion strategies.
Pine Script®
● Mean Reversion Signals:
The indicator identifies two types of mean reversion signals:
Both types of signals are plotted on the oscillator and the main chart, helping traders to quickly identify potential trade entries or exits.
● Dynamic Bands and Thresholds:
The oscillator includes overbought and oversold bands based on a dynamically calculated standard deviation and EMA. These bands provide visual boundaries for identifying extreme price conditions, helping traders anticipate potential reversals at these levels.

● Real-Time Labels:
Labels are displayed at key thresholds and bands to indicate the oscillator’s status: "Overbought," "Oversold," and "Neutral". Mean reversion signals are also displayed on the main chart, providing an at-a-glance summary of current indicator conditions.

● Customizable Threshold Levels:
Traders can adjust the primary threshold and smoothing length according to their trading style. A higher threshold can reduce signal frequency, while a lower setting will provide more sensitivity to market reversals.
The Smooth Price Oscillator by BigBeluga is a refined, noise-filtered indicator designed to highlight mean reversion points with enhanced clarity. By providing both strong and simple reversion signals, as well as dynamic overbought/oversold bands, this tool allows traders to spot potential reversals and trend continuations with ease. Its dual representation on the oscillator and the main price chart offers flexibility and precision for any trading strategy focused on capturing cyclical market movements.
🔵 KEY FEATURES & USAGE
● SuperSmoother-Based Oscillator:
This oscillator uses Ehlers' SuperSmoother filter, applied to two different periods, to create a smooth output that highlights price momentum and reduces market noise. The dual-period application enables a comparison of long-term and short-term price movements, making it suitable for both trend-following and reversion strategies.
// @function SuperSmoother filter based on Ehlers Filter
// @param price (float) The price series to be smoothed
// @param period (int) The smoothing period
// @returns [float] Smoothed price
method smoother_F(float price, int period) =>
float step = 2.0 * math.pi / period
float a1 = math.exp(-math.sqrt(2) * math.pi / period)
float b1 = 2 * a1 * math.cos(math.sqrt(2) * step / period)
float c2 = b1
float c3 = -a1 * a1
float c1 = 1 - c2 - c3
float smoothed = 0.0
smoothed := bar_index >= 4
? c1 * (price + price[1]) / 2 + c2 * smoothed[1] + c3 * smoothed[2]
: price
smoothed
● Mean Reversion Signals:
The indicator identifies two types of mean reversion signals:
- Simple Mean Reversion Signals: Triggered when the oscillator moves between thresholds of 1 and Overbought or between thresholds -1 and Ovesold, providing additional reversion opportunities. These signals are useful for capturing shorter-term corrections in trending markets.
- Strong Mean Reversion Signals: Triggered when the oscillator above the overbought (upper band) or below oversold (lower band) thresholds, indicating a strong reversal point. These signals are marked with a "+" symbol on the chart for clear visibility.
Both types of signals are plotted on the oscillator and the main chart, helping traders to quickly identify potential trade entries or exits.
● Dynamic Bands and Thresholds:
The oscillator includes overbought and oversold bands based on a dynamically calculated standard deviation and EMA. These bands provide visual boundaries for identifying extreme price conditions, helping traders anticipate potential reversals at these levels.
● Real-Time Labels:
Labels are displayed at key thresholds and bands to indicate the oscillator’s status: "Overbought," "Oversold," and "Neutral". Mean reversion signals are also displayed on the main chart, providing an at-a-glance summary of current indicator conditions.
● Customizable Threshold Levels:
Traders can adjust the primary threshold and smoothing length according to their trading style. A higher threshold can reduce signal frequency, while a lower setting will provide more sensitivity to market reversals.
The Smooth Price Oscillator by BigBeluga is a refined, noise-filtered indicator designed to highlight mean reversion points with enhanced clarity. By providing both strong and simple reversion signals, as well as dynamic overbought/oversold bands, this tool allows traders to spot potential reversals and trend continuations with ease. Its dual representation on the oscillator and the main price chart offers flexibility and precision for any trading strategy focused on capturing cyclical market movements.
오픈 소스 스크립트
트레이딩뷰의 진정한 정신에 따라, 이 스크립트의 작성자는 이를 오픈소스로 공개하여 트레이더들이 기능을 검토하고 검증할 수 있도록 했습니다. 작성자에게 찬사를 보냅니다! 이 코드는 무료로 사용할 수 있지만, 코드를 재게시하는 경우 하우스 룰이 적용된다는 점을 기억하세요.
🔵Gain access to our powerful tools : bigbeluga.com/tv
🔵Join our free discord for updates : bigbeluga.com/discord
All scripts & content provided by BigBeluga are for informational & educational purposes only.
🔵Join our free discord for updates : bigbeluga.com/discord
All scripts & content provided by BigBeluga are for informational & educational purposes only.
면책사항
해당 정보와 게시물은 금융, 투자, 트레이딩 또는 기타 유형의 조언이나 권장 사항으로 간주되지 않으며, 트레이딩뷰에서 제공하거나 보증하는 것이 아닙니다. 자세한 내용은 이용 약관을 참조하세요.