OPEN-SOURCE SCRIPT
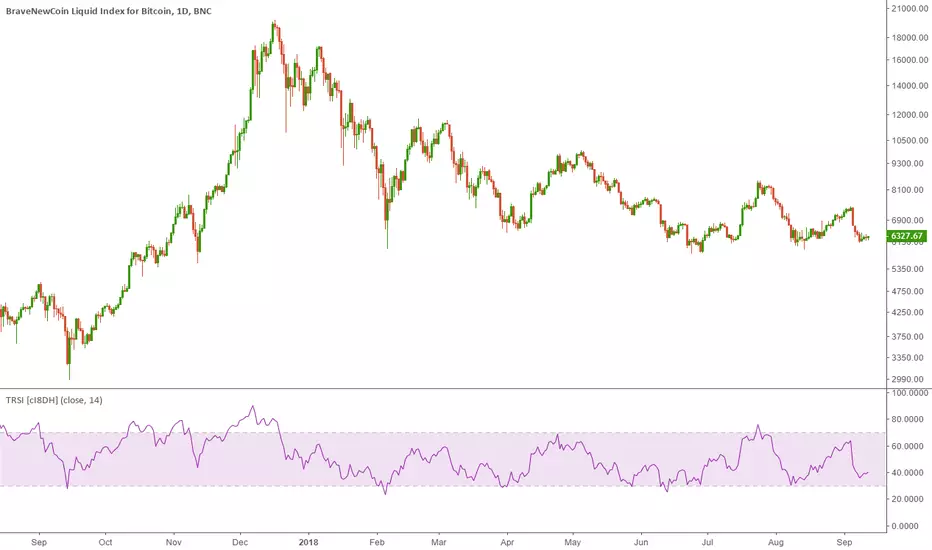
True Relative Strength Index (True RSI / TRSI) [cI8DH]

This indicator fixes RSI's bullish bias. This asymmetrical bias is illustrated in the chart below (the lower indicator pair).

This chart also shows that TRSI solves this issues (upper indicator pair). So, time to throw away your RSI. It has been fooling you all along.
FYI, this asymmetry is obvious in longer term charts (wide price ranges).
I kept this script simple for use as a reference. I will update my candle RSI indicator to implement this fix in addition to some other advanced features. So stay tuned :)
![RSI Candles [cI8DH]](https://s3.tradingview.com/d/DWKN9FKg_mid.png)
PS:
I included an option to display standard RSI as well for verifying the RSI equation I used. What you see in textbooks is a twisted version of the same equation.
Thanks DennisLeeBTC for the name suggestion.
오픈 소스 스크립트
트레이딩뷰의 진정한 정신에 따라, 이 스크립트의 작성자는 이를 오픈소스로 공개하여 트레이더들이 기능을 검토하고 검증할 수 있도록 했습니다. 작성자에게 찬사를 보냅니다! 이 코드는 무료로 사용할 수 있지만, 코드를 재게시하는 경우 하우스 룰이 적용된다는 점을 기억하세요.
면책사항
해당 정보와 게시물은 금융, 투자, 트레이딩 또는 기타 유형의 조언이나 권장 사항으로 간주되지 않으며, 트레이딩뷰에서 제공하거나 보증하는 것이 아닙니다. 자세한 내용은 이용 약관을 참조하세요.
오픈 소스 스크립트
트레이딩뷰의 진정한 정신에 따라, 이 스크립트의 작성자는 이를 오픈소스로 공개하여 트레이더들이 기능을 검토하고 검증할 수 있도록 했습니다. 작성자에게 찬사를 보냅니다! 이 코드는 무료로 사용할 수 있지만, 코드를 재게시하는 경우 하우스 룰이 적용된다는 점을 기억하세요.
면책사항
해당 정보와 게시물은 금융, 투자, 트레이딩 또는 기타 유형의 조언이나 권장 사항으로 간주되지 않으며, 트레이딩뷰에서 제공하거나 보증하는 것이 아닙니다. 자세한 내용은 이용 약관을 참조하세요.