OPEN-SOURCE SCRIPT
업데이트됨 Quick scan for drift
🙏🏻
ML based algorading is all about detecting any kind of non-randomness & exploiting it, kinda speculative stuff, not my way, but still...
Drift is one of the patterns that can be exploited, because pure random walks & noise aint got no drift.
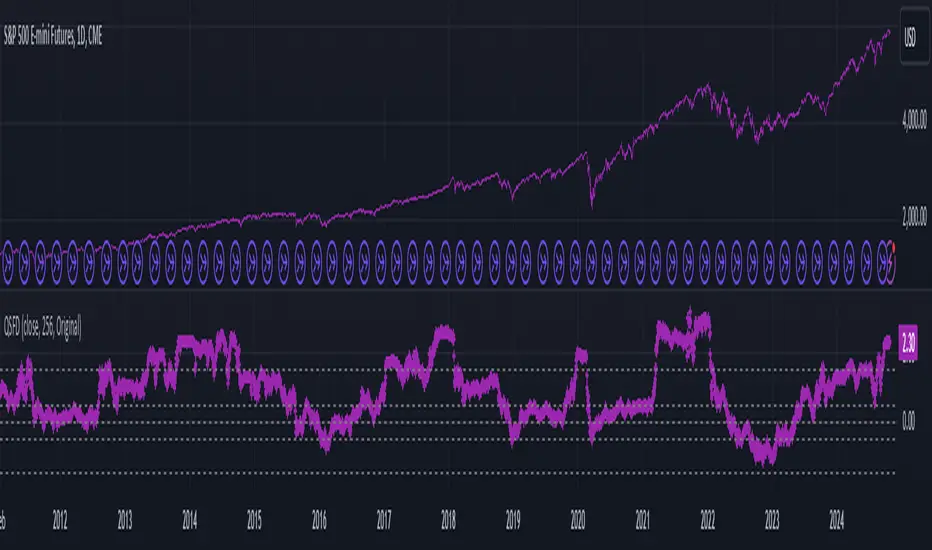
This is an efficient method to quickly scan tons of timeseries on the go & detect the ones with drift by simply checking wherther drift < -0.5 or drift > 0.5. The code can be further optimized both in general and for specific needs, but I left it like dat for clarity so you can understand how it works in a minute not in an hour

^^ proving 0.5 and -0.5 are natural limits with no need to optimize anything, we simply put the metric on random noise and see it sits in between -0.5 and 0.5
You can simply take this one and never check anything again if you require numerous live scans on the go. The metric is purely geometrical, no connection to stats, TSA, DSA or whatever. I've tested numerous formulas involving other scaling techniques, drift estimates etc (even made a recursive algo that had a great potential to be written about in a paper, but not this time I gues lol), this one has the highest info gain aka info content.
The timeseries filtered by this lil metric can be further analyzed & modelled with more sophisticated tools.
Live Long and Prosper
P.S.: there's no such thing as polynomial trend/drift, it's alwasy linear, these curves you see are just really long cycles
P.S.: does cheer still work on TV? admin
ML based algorading is all about detecting any kind of non-randomness & exploiting it, kinda speculative stuff, not my way, but still...
Drift is one of the patterns that can be exploited, because pure random walks & noise aint got no drift.
This is an efficient method to quickly scan tons of timeseries on the go & detect the ones with drift by simply checking wherther drift < -0.5 or drift > 0.5. The code can be further optimized both in general and for specific needs, but I left it like dat for clarity so you can understand how it works in a minute not in an hour
^^ proving 0.5 and -0.5 are natural limits with no need to optimize anything, we simply put the metric on random noise and see it sits in between -0.5 and 0.5
You can simply take this one and never check anything again if you require numerous live scans on the go. The metric is purely geometrical, no connection to stats, TSA, DSA or whatever. I've tested numerous formulas involving other scaling techniques, drift estimates etc (even made a recursive algo that had a great potential to be written about in a paper, but not this time I gues lol), this one has the highest info gain aka info content.
The timeseries filtered by this lil metric can be further analyzed & modelled with more sophisticated tools.
Live Long and Prosper
P.S.: there's no such thing as polynomial trend/drift, it's alwasy linear, these curves you see are just really long cycles
P.S.: does cheer still work on TV? admin
릴리즈 노트
Fixes:* Corrected data intergration formula
New:
* Added Type 1 formula (Type 0 is the one from the original version). Type 1 formula can be used incrementally with no need to recalculate the whole thing on each data udpade, alors it has lesser info gain and no sensefull thresholds, so ain't no confirming/rejecting drift hypothesises, it's rather a tool to feed the drift/trend intensity to other metrics (more about that in later drops)
오픈 소스 스크립트
트레이딩뷰의 진정한 정신에 따라, 이 스크립트의 작성자는 이를 오픈소스로 공개하여 트레이더들이 기능을 검토하고 검증할 수 있도록 했습니다. 작성자에게 찬사를 보냅니다! 이 코드는 무료로 사용할 수 있지만, 코드를 재게시하는 경우 하우스 룰이 적용된다는 점을 기억하세요.
Gor Dragongor
t.me/synchro1_channel
linkedin.com/company/synchro1
t.me/synchro1_channel
linkedin.com/company/synchro1
면책사항
해당 정보와 게시물은 금융, 투자, 트레이딩 또는 기타 유형의 조언이나 권장 사항으로 간주되지 않으며, 트레이딩뷰에서 제공하거나 보증하는 것이 아닙니다. 자세한 내용은 이용 약관을 참조하세요.