OPEN-SOURCE SCRIPT
업데이트됨 Portfolio Summary
The stocks in my portfolio has very poor performance since the FED hiked the rate.
since the covid-19, i came to the stock market and buy a stock that i ever heard the name which i don't even know its fundamental.
Some stock, i bought them at the hilltop (and sell at the bottom, hehe).
Everyone is a genius in a bull market ; and now i realized i am gonna loss money.
I have to do something, so i looked for an indicator that allow me to manage my portfolio.
unfortunately, i cannot find one that fit me.
so i make this indicator.
How you can get the benefit from this indicator
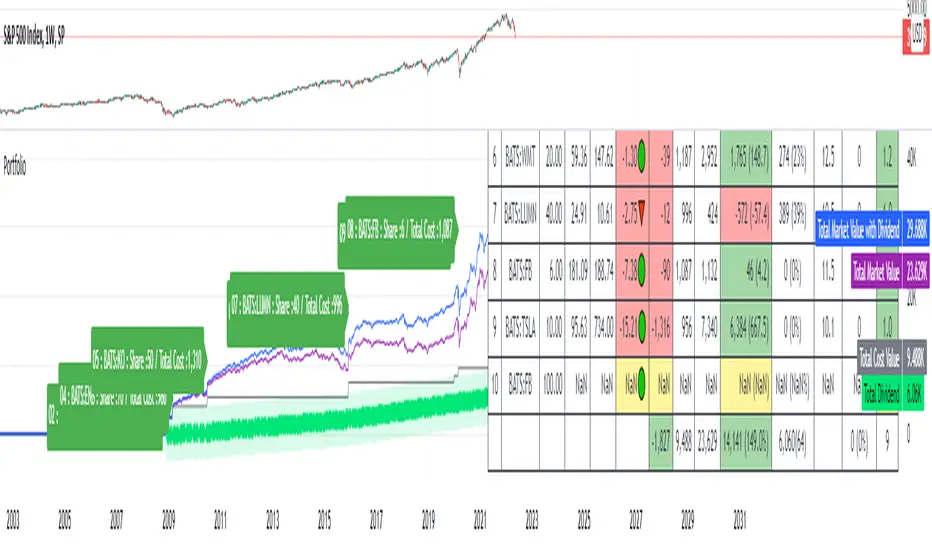
This indicator will summarize the gain/loss since you bought the stock.
it also include the dividend.
So that you can see how much you gain and loss, and make a decision as you wish.
How to use it
1. Input some neccessary data like ticker/stock (up to 20 tickers, yeah i know, it is too much), share, average price which you can input manually or depend on your entry date.
2. The indicator will calculate gain/loss, dividend, % of your portfolio.
3. You can select how to display based on "Index" or "Market Value".
4. You can toggle on/off both label and table.
Disclaimer
This indicator may display inaccurate and need a lot of improvement.
pls use carefully.
if you have any suggestion, pls dont hersitate to comment below.
Enjoy.


since the covid-19, i came to the stock market and buy a stock that i ever heard the name which i don't even know its fundamental.
Some stock, i bought them at the hilltop (and sell at the bottom, hehe).
Everyone is a genius in a bull market ; and now i realized i am gonna loss money.
I have to do something, so i looked for an indicator that allow me to manage my portfolio.
unfortunately, i cannot find one that fit me.
so i make this indicator.
How you can get the benefit from this indicator
This indicator will summarize the gain/loss since you bought the stock.
it also include the dividend.
So that you can see how much you gain and loss, and make a decision as you wish.
How to use it
1. Input some neccessary data like ticker/stock (up to 20 tickers, yeah i know, it is too much), share, average price which you can input manually or depend on your entry date.
2. The indicator will calculate gain/loss, dividend, % of your portfolio.
3. You can select how to display based on "Index" or "Market Value".
4. You can toggle on/off both label and table.
Disclaimer
This indicator may display inaccurate and need a lot of improvement.
pls use carefully.
if you have any suggestion, pls dont hersitate to comment below.
Enjoy.
릴리즈 노트
Symbol error fixed.릴리즈 노트
- Rearranged the script.
- Added stop loss, take profit based on price, percent and ATR.
- Added alert if market price hit entry price, stop loss price and target price.
- Reduced number of asset from 20 to 10 assets for better performance.
Enjoy.
PS.
1) Use at your own risk.
2) Next improvement : Portfolio benmarking, CAPM.
오픈 소스 스크립트
트레이딩뷰의 진정한 정신에 따라, 이 스크립트의 작성자는 이를 오픈소스로 공개하여 트레이더들이 기능을 검토하고 검증할 수 있도록 했습니다. 작성자에게 찬사를 보냅니다! 이 코드는 무료로 사용할 수 있지만, 코드를 재게시하는 경우 하우스 룰이 적용된다는 점을 기억하세요.
면책사항
해당 정보와 게시물은 금융, 투자, 트레이딩 또는 기타 유형의 조언이나 권장 사항으로 간주되지 않으며, 트레이딩뷰에서 제공하거나 보증하는 것이 아닙니다. 자세한 내용은 이용 약관을 참조하세요.
오픈 소스 스크립트
트레이딩뷰의 진정한 정신에 따라, 이 스크립트의 작성자는 이를 오픈소스로 공개하여 트레이더들이 기능을 검토하고 검증할 수 있도록 했습니다. 작성자에게 찬사를 보냅니다! 이 코드는 무료로 사용할 수 있지만, 코드를 재게시하는 경우 하우스 룰이 적용된다는 점을 기억하세요.
면책사항
해당 정보와 게시물은 금융, 투자, 트레이딩 또는 기타 유형의 조언이나 권장 사항으로 간주되지 않으며, 트레이딩뷰에서 제공하거나 보증하는 것이 아닙니다. 자세한 내용은 이용 약관을 참조하세요.