OPEN-SOURCE SCRIPT
Garman-Klass-Yang-Zhang Volatility Estimator
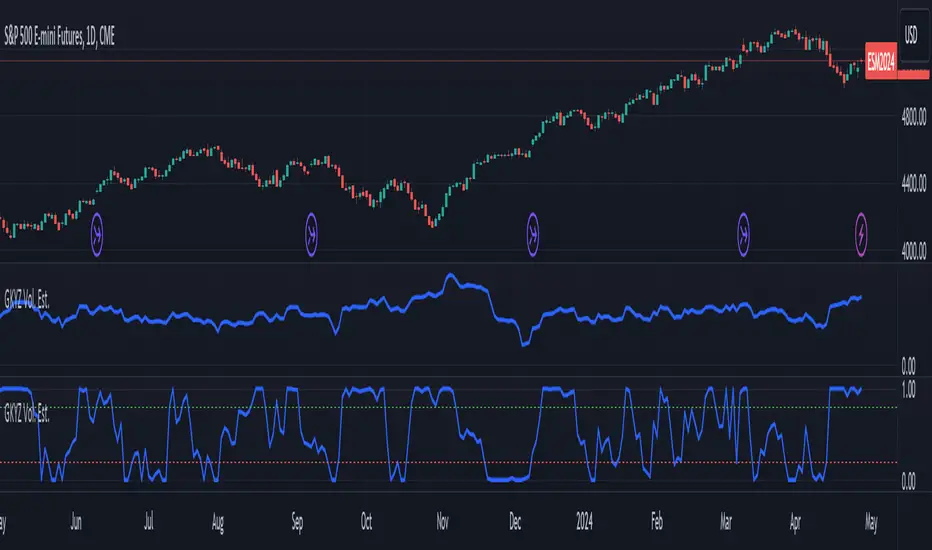
The Garman-Klass-Yang-Zhang Volatility Estimator (GKYZVE) is yet another attempt to robustly measure volatility, integrating intra-candle and inter-candle dynamics. It is an extension of the Garman-Klass Volatility Estimator (GKVE) incorporating insights from the Yang-Zhang Volatility Estimator (YZVE). Like the YZVE, the GKYZVE holistically considers open, high, low, and close prices. The formula for GKYZ is:
GKYZVE = 0.5 * σ_HL² + [(2 * math.log(2) -1)] * σ_CC² + σ_OC²
Where:
The GKYZVE differs from the YZVE by using fixed weighing factors derived from theoretical calculations, leaning heavier into the assumption that returns are log-distributed.
This script also offers a choice for normalization between 0 and 1, turning the estimator into an oscillator for comparing current volatility to recent levels. Horizontal lines at user-defined levels are also available for clearer visualization. Both options are off by default.
References:
Garman, M. B., & Klass, M. J. (1980). On the estimation of security price volatilities from historical data. The Journal of Business, 53(1), 67-78.
Yang, D., & Zhang, Q. (2000). Drift-independent volatility estimation based on high, low, open, and close prices. The Journal of Business, 73(3), 477-492.
GKYZVE = 0.5 * σ_HL² + [(2 * math.log(2) -1)] * σ_CC² + σ_OC²
Where:
- σ_HL² is the variance based on the high and low prices (σ_HL² = (high - low)² / (4 * math.log(2))), weighted at 0.5.
- σ_CC² is the close-to-close variance (σ_CC² = (close[1] - close)²), weighted at (2 ln 2) -1 for the logarithmic distribution of returns and emphasizing the impact of day-to-day price changes.
- σ_OC² is the variance of the opening price against the closing price (σ_OC² = 0.5 * (open - close)²), weighted at 1.
The GKYZVE differs from the YZVE by using fixed weighing factors derived from theoretical calculations, leaning heavier into the assumption that returns are log-distributed.
This script also offers a choice for normalization between 0 and 1, turning the estimator into an oscillator for comparing current volatility to recent levels. Horizontal lines at user-defined levels are also available for clearer visualization. Both options are off by default.
References:
Garman, M. B., & Klass, M. J. (1980). On the estimation of security price volatilities from historical data. The Journal of Business, 53(1), 67-78.
Yang, D., & Zhang, Q. (2000). Drift-independent volatility estimation based on high, low, open, and close prices. The Journal of Business, 73(3), 477-492.
오픈 소스 스크립트
트레이딩뷰의 진정한 정신에 따라, 이 스크립트의 작성자는 이를 오픈소스로 공개하여 트레이더들이 기능을 검토하고 검증할 수 있도록 했습니다. 작성자에게 찬사를 보냅니다! 이 코드는 무료로 사용할 수 있지만, 코드를 재게시하는 경우 하우스 룰이 적용된다는 점을 기억하세요.
면책사항
해당 정보와 게시물은 금융, 투자, 트레이딩 또는 기타 유형의 조언이나 권장 사항으로 간주되지 않으며, 트레이딩뷰에서 제공하거나 보증하는 것이 아닙니다. 자세한 내용은 이용 약관을 참조하세요.
오픈 소스 스크립트
트레이딩뷰의 진정한 정신에 따라, 이 스크립트의 작성자는 이를 오픈소스로 공개하여 트레이더들이 기능을 검토하고 검증할 수 있도록 했습니다. 작성자에게 찬사를 보냅니다! 이 코드는 무료로 사용할 수 있지만, 코드를 재게시하는 경우 하우스 룰이 적용된다는 점을 기억하세요.
면책사항
해당 정보와 게시물은 금융, 투자, 트레이딩 또는 기타 유형의 조언이나 권장 사항으로 간주되지 않으며, 트레이딩뷰에서 제공하거나 보증하는 것이 아닙니다. 자세한 내용은 이용 약관을 참조하세요.