PROTECTED SOURCE SCRIPT
r - g Oscillator | Norm + Sigma-Bands
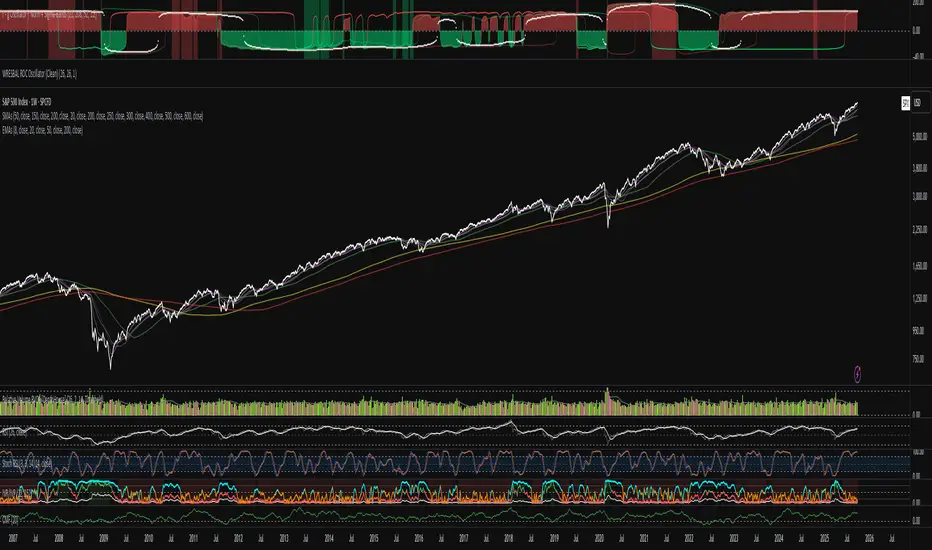
The r–g Oscillator measures the macro-liquidity regime by tracking the gap between real interest rates (r) and nominal GDP growth (g).
It approximates real rate pressure using the 10-Year Treasury yield minus the 5-Year/5-Year forward inflation expectation, and compares that to either Real or Nominal U.S. GDP YoY growth.
Green (g > r): Expansionary backdrop — growth outpaces real yields; liquidity tailwinds.
Red (r > g): Contractionary backdrop — real rates restrictive; liquidity headwinds.
The σ-bands (standard-deviation envelopes) highlight statistically extreme expansions or contractions in the r–g spread.
The “sweet-spot” shading marks moments when r–g breaks strongly above/below zero — early-cycle thrusts or late-cycle stress.
Optional normalization rescales r–g between –1 and +1 to compare across cycles.
Use:
Track shifts in the macro tide rather than short-term waves. Sustained green phases typically align with bull-market environments; red phases often coincide with tightening cycles or recessions. Combine with faster liquidity or breadth measures (e.g., WRESBAL ROC) for tactical confirmation.
보호된 스크립트입니다
이 스크립트는 비공개 소스로 게시됩니다. 하지만 이를 자유롭게 제한 없이 사용할 수 있습니다 – 자세한 내용은 여기에서 확인하세요.
면책사항
해당 정보와 게시물은 금융, 투자, 트레이딩 또는 기타 유형의 조언이나 권장 사항으로 간주되지 않으며, 트레이딩뷰에서 제공하거나 보증하는 것이 아닙니다. 자세한 내용은 이용 약관을 참조하세요.
보호된 스크립트입니다
이 스크립트는 비공개 소스로 게시됩니다. 하지만 이를 자유롭게 제한 없이 사용할 수 있습니다 – 자세한 내용은 여기에서 확인하세요.
면책사항
해당 정보와 게시물은 금융, 투자, 트레이딩 또는 기타 유형의 조언이나 권장 사항으로 간주되지 않으며, 트레이딩뷰에서 제공하거나 보증하는 것이 아닙니다. 자세한 내용은 이용 약관을 참조하세요.