OPEN-SOURCE SCRIPT
Volatility %
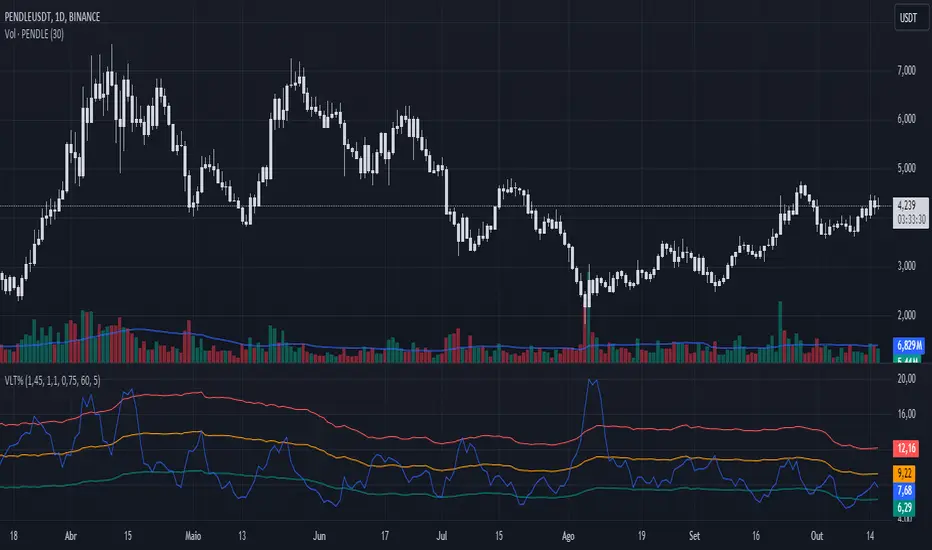
This indicator compares the average range of candles over a long period with the average range of a short period (which can be defined according to whether the strategy is more long-term or short-term), thus allowing the measurement of the asset's volatility or the strength of the movement. It was also created to be used on the 1D time frame with Swing Trading.
This indicator does not aim to predict the direction or strength of the next movement, but seeks to indicate whether the asset's value is moving more or less than the average. Based on the principle of alternation, after a large movement, there will likely be a short movement, and after a short movement, there will likely be a long one. Therefore, phases with less movement can be a good time to position oneself, and if volatility starts to decrease and the target has not been reached, closing the position can be considered.
This indicator also comes with three bands of percentage volatility averages altered by a multiplier, allowing for a dynamic reading of how volatile the market is. These should be adapted according to the asset.
This indicator is not meant to be used alone but as an auxiliary indicator.
오픈 소스 스크립트
트레이딩뷰의 진정한 정신에 따라, 이 스크립트의 작성자는 이를 오픈소스로 공개하여 트레이더들이 기능을 검토하고 검증할 수 있도록 했습니다. 작성자에게 찬사를 보냅니다! 이 코드는 무료로 사용할 수 있지만, 코드를 재게시하는 경우 하우스 룰이 적용된다는 점을 기억하세요.
면책사항
해당 정보와 게시물은 금융, 투자, 트레이딩 또는 기타 유형의 조언이나 권장 사항으로 간주되지 않으며, 트레이딩뷰에서 제공하거나 보증하는 것이 아닙니다. 자세한 내용은 이용 약관을 참조하세요.
오픈 소스 스크립트
트레이딩뷰의 진정한 정신에 따라, 이 스크립트의 작성자는 이를 오픈소스로 공개하여 트레이더들이 기능을 검토하고 검증할 수 있도록 했습니다. 작성자에게 찬사를 보냅니다! 이 코드는 무료로 사용할 수 있지만, 코드를 재게시하는 경우 하우스 룰이 적용된다는 점을 기억하세요.
면책사항
해당 정보와 게시물은 금융, 투자, 트레이딩 또는 기타 유형의 조언이나 권장 사항으로 간주되지 않으며, 트레이딩뷰에서 제공하거나 보증하는 것이 아닙니다. 자세한 내용은 이용 약관을 참조하세요.