OPEN-SOURCE SCRIPT
Bitcoin Bubble Risk (Adjusted for Diminishing Returns)
Description:
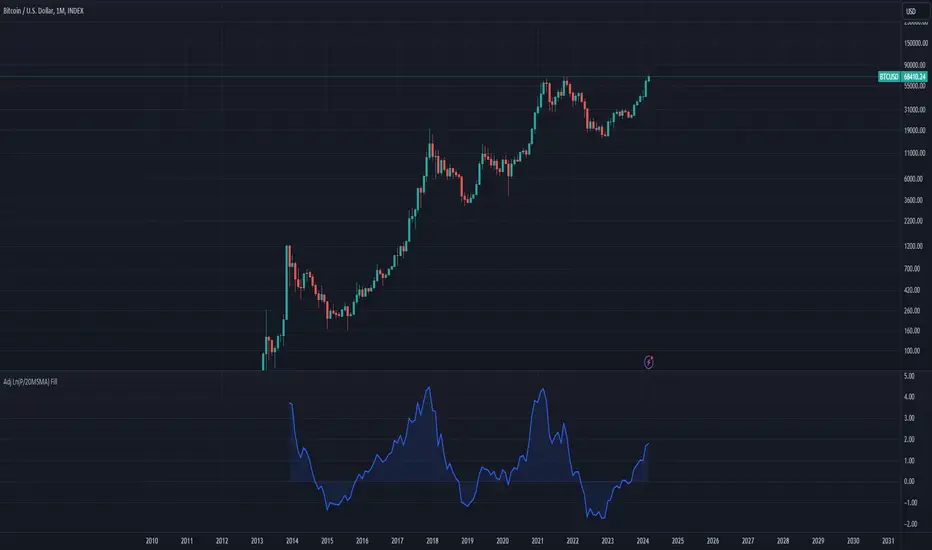
This indicator offers a unique lens through which traders can assess risk in the Bitcoin market, specifically tailored to recognize the phenomenon of diminishing returns. By calculating the natural logarithm of the price relative to a 20-month Simple Moving Average (SMA) and applying a dynamic normalization process, this tool highlights periods of varying risk based on historical price movements and adjusted returns. The indicator is designed to provide nuanced insights into potential risk levels, aiding traders in their decision-making processes.
Usage:
To effectively use this indicator, apply it to your chart while ensuring that Bitcoin's price is set to display in monthly candles. This setting is vital for the indicator to accurately reflect the market's risk levels, as it relies on long-term data aggregation to inform its analysis.
This tool is especially beneficial for traders focused on medium to long-term investment horizons in Bitcoin, offering insights into when the market may be entering higher or lower risk phases. By incorporating this indicator into your analysis, you can gain a deeper understanding of potential risk exposures based on the adjusted price trends and market conditions.
Originality and Utility:
This script stands out for its innovative approach to risk analysis in the cryptocurrency space. By adjusting for the diminishing returns seen in mature markets, it provides a refined perspective on risk levels, enhancing traditional methodologies. This script is a significant contribution to the TradingView community, offering a unique tool for traders aiming to navigate the complexities of the Bitcoin market with informed risk management strategies.
Important Note:
This indicator is for informational purposes only and should not be considered investment advice. Users are encouraged to conduct their own research and consult with financial professionals before making investment decisions. The accuracy of the indicator's predictions can only be ensured when applied to monthly candlestick charts of Bitcoin.
오픈 소스 스크립트
트레이딩뷰의 진정한 정신에 따라, 이 스크립트의 작성자는 이를 오픈소스로 공개하여 트레이더들이 기능을 검토하고 검증할 수 있도록 했습니다. 작성자에게 찬사를 보냅니다! 이 코드는 무료로 사용할 수 있지만, 코드를 재게시하는 경우 하우스 룰이 적용된다는 점을 기억하세요.
면책사항
해당 정보와 게시물은 금융, 투자, 트레이딩 또는 기타 유형의 조언이나 권장 사항으로 간주되지 않으며, 트레이딩뷰에서 제공하거나 보증하는 것이 아닙니다. 자세한 내용은 이용 약관을 참조하세요.
오픈 소스 스크립트
트레이딩뷰의 진정한 정신에 따라, 이 스크립트의 작성자는 이를 오픈소스로 공개하여 트레이더들이 기능을 검토하고 검증할 수 있도록 했습니다. 작성자에게 찬사를 보냅니다! 이 코드는 무료로 사용할 수 있지만, 코드를 재게시하는 경우 하우스 룰이 적용된다는 점을 기억하세요.
면책사항
해당 정보와 게시물은 금융, 투자, 트레이딩 또는 기타 유형의 조언이나 권장 사항으로 간주되지 않으며, 트레이딩뷰에서 제공하거나 보증하는 것이 아닙니다. 자세한 내용은 이용 약관을 참조하세요.