OPEN-SOURCE SCRIPT
업데이트됨 Fibonacci Trading
Fibonacci Trading
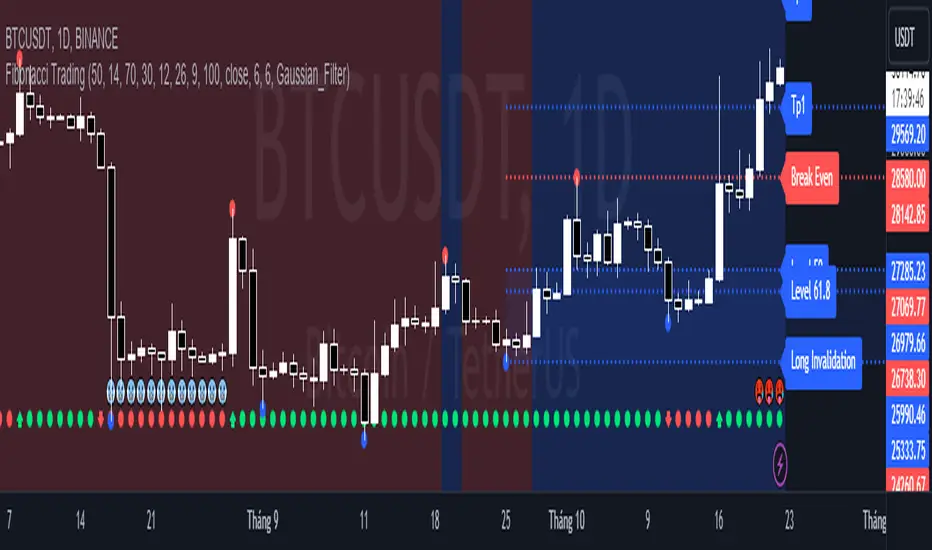
This simple script draw Fibonacci Retracement to define pullback level and draw Fibonacci Extension to define target level of a upward wave or doward wave
1. Upward wave
1.1 Fibonacci Retracement
+ Fibonacci Retracement measuare from support to nearest resistance on the right.
+ Retracement Level 0 named as "Breake Even"
+ Retracement Level 100 named as "Long Invalidation"
+ Retracement Level 50 and 61.8 is ploted as blue line
+ The zone between Retracement Level 50 and 100 is filled by blue color and named as "Buy zone"
1.2 Fibonacci Extension
+ Fibonacci Extension measuare from Retracement Level 61.8 to Retracement Level 0
+ Fibonacci Extension Level 161.8 named as "Tp1 (Target point 1)"
+ Fibonacci Extension Level 261.8 named as "Tp2 (Target point 2)"
2. Doward wave
2.1 Fibonacci Retracement
+ Fibonacci Retracement measuare from resistance to nearest support on the right.
+ Retracement Level 0 named as "Breake Even"
+ Retracement Level 100 named as "Short Invalidation"
+ Retracement Level 50 and 61.8 is ploted as red line
+ The zone between Retracement Level 50 and 100 is filled by red color and named as "Sell zone"
2.2 Fibonacci Extension
+ Fibonacci Extension measuare from Retracement Level 61.8 to Retracement Level 0
+ Fibonacci Extension Level 161.8 named as "Tp1 (Target point 1)"
+ Fibonacci Extension Level 261.8 named as "Tp2 (Target point 2)"
3. Trading Setup
3.1 Long Only: Only display Fibonacci of Upward wave
3.2 Short Only: Only display Fibonacci of Doward wave
3.3 Both: Display both Fibonacci of Upward wave and Doward wave
릴리즈 노트
Update Feature MA Cycle in Trading Setup.3.4 MA Cycle: When EMA above SMA auto display Fibonacci of Upward wave, When EMA below SMA auto display Fibonacci of Downward wave.
Notes: When EMA above SMA, background is filled by blue. When EMA below SMA, background is filled by red. Uncheck "Fill background" to disable filling.
릴리즈 노트
Update Feature RSI MACD in Trading Setup3.5 RSI MACD:
* When RSI cross down over sold level and then MACD create Buy Signal this script auto display Fibonacci of Upward wave
* When RSI cross up over bought level and then MACD create Sell Signal this script auto display Fibonacci of Downward wave
* Notes:
+ When MACD create Buy Signal after RSI oversold, background is filled by blue.
+ When MACD create Sell Signal after RSI overbought, background is filled by red.
+ Uncheck "RSI MACD Background Filling" to disable filling.
릴리즈 노트
Update feature Gaussian Filter in Trading Setup3.6 Gaussian Filter:
* When price moving above Gaussian Filter, this script auto display Fibonacci of Upward wave.
* When price moving below Gaussian Filter, this script auto display Fibonacci of Downward wave.
* Notes:
+ When price moving above Gaussian Filter, background is filled by blue.
+ When price moving below Gaussian Filter, background is filled by red.
+ Uncheck Fill background to disable filling.
오픈 소스 스크립트
트레이딩뷰의 진정한 정신에 따라, 이 스크립트의 작성자는 이를 오픈소스로 공개하여 트레이더들이 기능을 검토하고 검증할 수 있도록 했습니다. 작성자에게 찬사를 보냅니다! 이 코드는 무료로 사용할 수 있지만, 코드를 재게시하는 경우 하우스 룰이 적용된다는 점을 기억하세요.
면책사항
해당 정보와 게시물은 금융, 투자, 트레이딩 또는 기타 유형의 조언이나 권장 사항으로 간주되지 않으며, 트레이딩뷰에서 제공하거나 보증하는 것이 아닙니다. 자세한 내용은 이용 약관을 참조하세요.
오픈 소스 스크립트
트레이딩뷰의 진정한 정신에 따라, 이 스크립트의 작성자는 이를 오픈소스로 공개하여 트레이더들이 기능을 검토하고 검증할 수 있도록 했습니다. 작성자에게 찬사를 보냅니다! 이 코드는 무료로 사용할 수 있지만, 코드를 재게시하는 경우 하우스 룰이 적용된다는 점을 기억하세요.
면책사항
해당 정보와 게시물은 금융, 투자, 트레이딩 또는 기타 유형의 조언이나 권장 사항으로 간주되지 않으며, 트레이딩뷰에서 제공하거나 보증하는 것이 아닙니다. 자세한 내용은 이용 약관을 참조하세요.