OPEN-SOURCE SCRIPT
Normalized ZScore

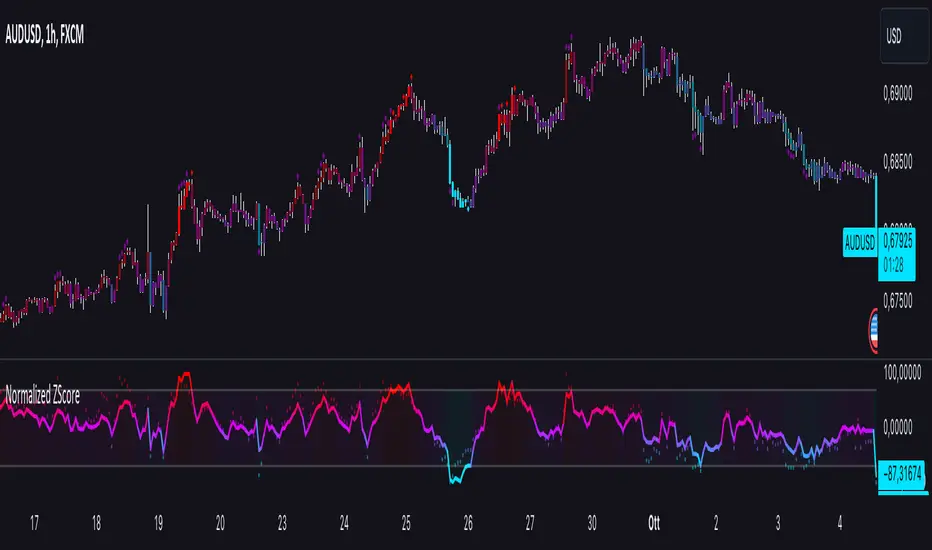
The Normalized ZScore Indicator is a dynamic tool designed to help traders identify potential overbought and oversold conditions in the market. It calculates the ZScore of the price movement relative to a moving average, allowing users to track the deviation of price from its average and normalize it within a fixed range for clearer signal generation. The indicator can be used for both trend-following and mean-reversion strategies, offering customizable options for various trading styles.
How It Works
This indicator works by calculating two distinct ZScores:
Standard ZScore: Based on the price deviation from a simple moving average (SMA).
Fast ZScore: Calculated using price deviation from the SMA combined with standard deviation over a shorter period.
The ZScore values are normalized between -100 and 100, allowing for consistent and comparable signal outputs across different assets and timeframes.
Key Features
Customizable MA and Deviation Lengths: Adjust the length of the moving average (MA Length) and deviation (Deviation Length) to suit your trading needs.
Overbought/Oversold Zones: The indicator highlights areas where the market may be overbought or oversold using a user-defined threshold.
Color-Coded Signals: The ZScore plot changes color based on market conditions:
Positive ZScore (overbought) = Customizable Positive Color
Neutral ZScore = Customizable Middle Color
Negative ZScore (oversold) = Customizable Negative Color
Trend Filtering Option: The built-in trend filter helps to enhance signal accuracy by factoring in the overall market trend.
Signal Shapes:
Diamonds: Indicate strong long or short entry signals when ZScore crosses predefined thresholds.
X-Crosses: Indicate weaker long or short entry signals for users preferring caution in their trades.
Inputs
MA Length: Set the length of the moving average used for calculating the ZScore.
Deviation Length: Set the length used for deviation calculations.
OBS Threshold: Set the threshold for defining overbought and oversold zones.
Trend Filter: Enable or disable the trend filter for added signal confidence.
Color Settings: Customize the colors for positive, middle, and negative ZScore values.
Visual Features
ZScore Plot: A smooth and color-coded line plot to visualize the ZScore in real-time.
Overbought/Oversold Zones: Visualized with horizontal lines and fill colors to highlight extremes.
Bar Coloring: Bars change colors when ZScore exceeds overbought/oversold zones, enhancing visual clarity.
Signal Markers: Diamond or X-shaped markers appear on the chart to indicate potential trade signals.
How to Use
Entry Points: Look for the ZScore to cross into overbought/oversold regions for potential reversal trades. Use the diamonds and X-crosses for long and short entries.
Trend Filter: Enable the trend filter to avoid taking trades against the overall market trend.
Customize Settings: Adjust the lengths and colors to match your specific trading strategy and timeframe.
오픈 소스 스크립트
트레이딩뷰의 진정한 정신에 따라, 이 스크립트의 작성자는 이를 오픈소스로 공개하여 트레이더들이 기능을 검토하고 검증할 수 있도록 했습니다. 작성자에게 찬사를 보냅니다! 이 코드는 무료로 사용할 수 있지만, 코드를 재게시하는 경우 하우스 룰이 적용된다는 점을 기억하세요.
면책사항
해당 정보와 게시물은 금융, 투자, 트레이딩 또는 기타 유형의 조언이나 권장 사항으로 간주되지 않으며, 트레이딩뷰에서 제공하거나 보증하는 것이 아닙니다. 자세한 내용은 이용 약관을 참조하세요.
오픈 소스 스크립트
트레이딩뷰의 진정한 정신에 따라, 이 스크립트의 작성자는 이를 오픈소스로 공개하여 트레이더들이 기능을 검토하고 검증할 수 있도록 했습니다. 작성자에게 찬사를 보냅니다! 이 코드는 무료로 사용할 수 있지만, 코드를 재게시하는 경우 하우스 룰이 적용된다는 점을 기억하세요.
면책사항
해당 정보와 게시물은 금융, 투자, 트레이딩 또는 기타 유형의 조언이나 권장 사항으로 간주되지 않으며, 트레이딩뷰에서 제공하거나 보증하는 것이 아닙니다. 자세한 내용은 이용 약관을 참조하세요.